Jump to content


Photo

It continues to be the


  • Please log in to reply
16 replies to this topic

#11 tsharp

tsharp

    Member

  • Traders-Talk User
  • 1,487 posts

Posted 01 April 2016 - 07:00 PM


Long has been good, price is the king. all indicator tells wrong, but one smile.png


really? long what? and from when?

GS - since nov 197 -> 159 or DB 24 ->14 or DAX 11300 -> 9850

even S&P since nov - at best breakeven. Nasdaq is still negative.


I posted this over on the Swing Waves board almost a month ago:


My work showed a buy on the daily bars on 2/16, the break of the DTL on the CCI, and confirmed with the break of the UTL.  Now that we are approaching the 0 line on the CCI, we may see a pause, or if the numbers out tomorrow morning may cause the CCI to leap across, then retest next week... time will tell.


http://s20.postimg.o...y_EW_3_3_16.jpg


I use the SPX as a proxy for the SPY LEAPS option contracts and am long slightly ahead of that signal.


#12 diogenes227

diogenes227

    Member

  • TT Patron+
  • 5,120 posts

Posted 01 April 2016 - 10:20 PM


Long has been good, price is the king. all indicator tells wrong, but one smile.png


really? long what? and from when?

GS - since nov 197 -> 159 or DB 24 ->14 or DAX 11300 -> 9850

even S&P since nov - at best breakeven. Nasdaq is still negative.


I posted this over on the Swing Waves board almost a month ago:


My work showed a buy on the daily bars on 2/16, the break of the DTL on the CCI, and confirmed with the break of the UTL.  Now that we are approaching the 0 line on the CCI, we may see a pause, or if the numbers out tomorrow morning may cause the CCI to leap across, then retest next week... time will tell.


http://s20.postimg.o...y_EW_3_3_16.jpg


I use the SPX as a proxy for the SPY LEAPS option contracts and am long slightly ahead of that signal.


I was going to start this in a new topic thread but I might as well chime in here. 


First of all, picking November as a starting point is, in a market-timing discussion, as arbitrary now as pointing to the time the President suggested a market bottom four days before the market bottomed at SPX 666.


Secondly, that comment above "price is the king. all indicator tells wrong, but one"?  Congrats on getting the rally right on price alone but "all indicator tells" are not wrong.  Price versus breadth has long been  the subject of a sometimes tiresome debate on this site, tiresome because it never has had to be "versus" since price is fine and a whole lot less fickle when it has breadth on its side. 


For reference, my post from Feb 16 below:


THE RALLY BEGINS


In that link I wrote: 


"What do you know?


A low-above-a-low divergence on the NYSI and the VIX drops below a bear-market 25, and since the 45 sells on my nifty-50 stock list six trading days ago (signalling a buy on the open of 2/9), TQQQ is already up 14%, TNA up 11%, UPRO up 9.9%, BIB and SOXL, both 14%.


Bears better maul this in a hurry or they could be staring last October in the face.


Well, the bears were unable to maul it and we've been living in October ever since. 


Those 3x-leveraged ETFs mentioned above have had fantastic runs on the buy signal from the open of the 16th: TQQQ now up 36 percent, TNA up 46 percent, UPRO up 33 percent and BIB has been the laggard up 8.9 percent while SOXL as been the star up 62 percent.  I don't even want to detail the futures and call returns beyond saying they are obviously even more astonishing.


So where are we now? 


I've written elsewhere that one of the great things about the McClellan Oscillator is that it gives warnings of the potential turns to come -- lows above lows on the NYMO for rallies (see the green circles on the chart below), and highs below highs before declines (the red circles below).  In each case there is confirmation when there is a subsequent NYSI turn to usually mark the intermediate beginning or end of the rally in a cycle that usually lasts 10 to 14 weeks from bottom to bottom (usually being the key word since there have obviously been both bullish and bearish exceptions). As of today we seeing the highs-below-highs warning for a turn to the downside but...but the NYSI continues to climb, and if today's buying follows through and turns up the NYMO Monday with a low above a low, the rally could go on for a while...maybe even rather crazily.


I should also note that I consider drop that ended on February 12th, giving the 16th open buy, to be a retest of the decline into late January.  That would put the current cycle at 10 weeks.  I may be wrong about the cycle calculation but I do think this has been one of those rally dances with some awfully pretty ladies in which, late in the evening, one can keep on dancing but probably should dance near the door.


Good luck and good trading.


"If you've heard this story before, don't stop me because I'd like to hear it again," Groucho Marx (on market history?).

“I've learned in options trading simple is best and the obvious is often the most elusive to recognize.”


"The god of trading rewards persistence, experience and discipline, and absolutely nothing else."


#13 alexnewbee

alexnewbee

    Member

  • Traders-Talk User
  • 1,459 posts

Posted 02 April 2016 - 06:38 AM


Long has been good, price is the king. all indicator tells wrong, but one smile.png


really? long what? and from when?

GS - since nov 197 -> 159 or DB 24 ->14 or DAX 11300 -> 9850

even S&P since nov - at best breakeven. Nasdaq is still negative.


You feel good if you count from Nov. smile.png


you could count from May or July 2015. Result will be even better ;)

especially for financials. 


"we do G.d's work" Lloyd Blankfein

#14 diogenes227

diogenes227

    Member

  • TT Patron+
  • 5,120 posts

Posted 02 April 2016 - 01:06 PM


Long has been good, price is the king. all indicator tells wrong, but one smile.png


really? long what? and from when?

GS - since nov 197 -> 159 or DB 24 ->14 or DAX 11300 -> 9850

even S&P since nov - at best breakeven. Nasdaq is still negative.


You feel good if you count from Nov. smile.png


you could count from May or July 2015. Result will be even better wink.png

especially for financials. 


 Took a look back at financials for fun and possible profit.


Here's my candidate to test the very idea of too big to fail when failing time comes around again.  There's a reverse 1-to-10 split in there from 2011 so what's it really selling at now, $4.20?


"If you've heard this story before, don't stop me because I'd like to hear it again," Groucho Marx (on market history?).

“I've learned in options trading simple is best and the obvious is often the most elusive to recognize.”


"The god of trading rewards persistence, experience and discipline, and absolutely nothing else."


#15 CRUISENAL

CRUISENAL

    Member

  • Traders-Talk User
  • 1,135 posts

Posted 02 April 2016 - 01:57 PM

Diogenes, Do you mind sharing how you overlay the NYSI on the SPY chart? If not I understand. Thanks   Alan 


Long has been good, price is the king. all indicator tells wrong, but one smile.png


really? long what? and from when?

GS - since nov 197 -> 159 or DB 24 ->14 or DAX 11300 -> 9850

even S&P since nov - at best breakeven. Nasdaq is still negative.


I posted this over on the Swing Waves board almost a month ago:


My work showed a buy on the daily bars on 2/16, the break of the DTL on the CCI, and confirmed with the break of the UTL.  Now that we are approaching the 0 line on the CCI, we may see a pause, or if the numbers out tomorrow morning may cause the CCI to leap across, then retest next week... time will tell.


http://s20.postimg.o...y_EW_3_3_16.jpg


I use the SPX as a proxy for the SPY LEAPS option contracts and am long slightly ahead of that signal.


I was going to start this in a new topic thread but I might as well chime in here. 


First of all, picking November as a starting point is, in a market-timing discussion, as arbitrary now as pointing to the time the President suggested a market bottom four days before the market bottomed at SPX 666.


Secondly, that comment above "price is the king. all indicator tells wrong, but one"?  Congrats on getting the rally right on price alone but "all indicator tells" are not wrong.  Price versus breadth has long been  the subject of a sometimes tiresome debate on this site, tiresome because it never has had to be "versus" since price is fine and a whole lot less fickle when it has breadth on its side. 


For reference, my post from Feb 16 below:


THE RALLY BEGINS


In that link I wrote: 


"What do you know?


A low-above-a-low divergence on the NYSI and the VIX drops below a bear-market 25, and since the 45 sells on my nifty-50 stock list six trading days ago (signalling a buy on the open of 2/9), TQQQ is already up 14%, TNA up 11%, UPRO up 9.9%, BIB and SOXL, both 14%.


Bears better maul this in a hurry or they could be staring last October in the face.


Well, the bears were unable to maul it and we've been living in October ever since. 


Those 3x-leveraged ETFs mentioned above have had fantastic runs on the buy signal from the open of the 16th: TQQQ now up 36 percent, TNA up 46 percent, UPRO up 33 percent and BIB has been the laggard up 8.9 percent while SOXL as been the star up 62 percent.  I don't even want to detail the futures and call returns beyond saying they are obviously even more astonishing.


So where are we now? 


I've written elsewhere that one of the great things about the McClellan Oscillator is that it gives warnings of the potential turns to come -- lows above lows on the NYMO for rallies (see the green circles on the chart below), and highs below highs before declines (the red circles below).  In each case there is confirmation when there is a subsequent NYSI turn to usually mark the intermediate beginning or end of the rally in a cycle that usually lasts 10 to 14 weeks from bottom to bottom (usually being the key word since there have obviously been both bullish and bearish exceptions). As of today we seeing the highs-below-highs warning for a turn to the downside but...but the NYSI continues to climb, and if today's buying follows through and turns up the NYMO Monday with a low above a low, the rally could go on for a while...maybe even rather crazily.


I should also note that I consider drop that ended on February 12th, giving the 16th open buy, to be a retest of the decline into late January.  That would put the current cycle at 10 weeks.  I may be wrong about the cycle calculation but I do think this has been one of those rally dances with some awfully pretty ladies in which, late in the evening, one can keep on dancing but probably should dance near the door.


Good luck and good trading.


#16 CRUISENAL

CRUISENAL

    Member

  • Traders-Talk User
  • 1,135 posts

Posted 02 April 2016 - 02:33 PM

I figured it out.


#17 bigbud

bigbud

    Member

  • Traders-Talk User
  • 539 posts

Posted 03 April 2016 - 08:47 AM

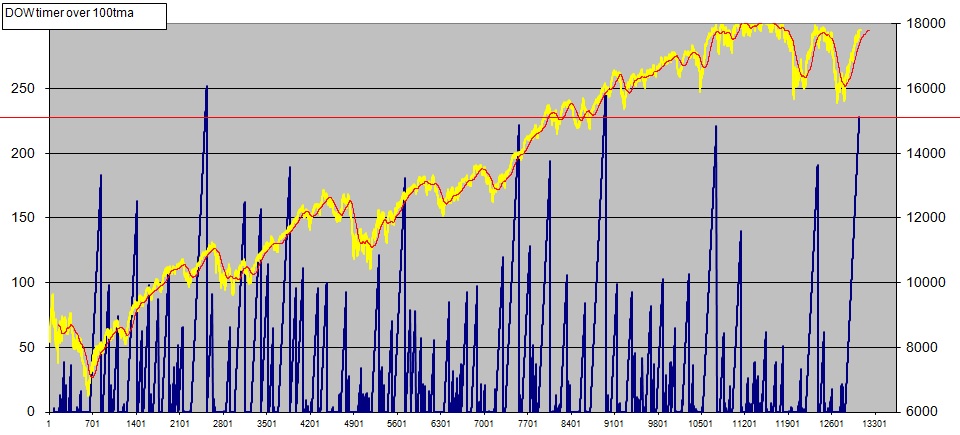
time for some kind of a pullback - number of hours above 100hourMA:

20160403b.jpg