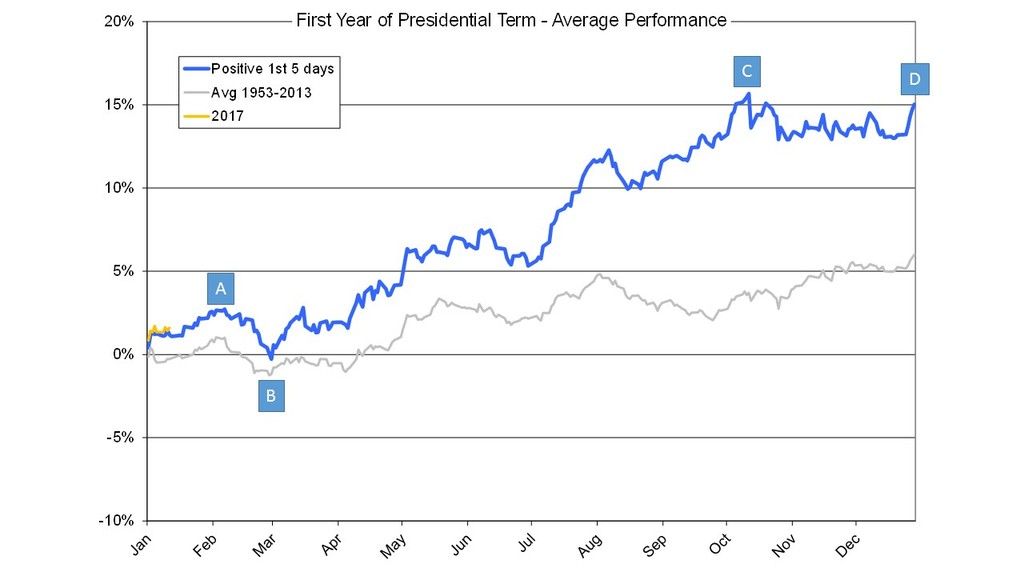
This is a follow-up to my previous post linked here. The first five trading days of 2017 are in the books, and the SPX was up 1.3% on day five. That is right in the middle of the range (0.7-2.2%) for previous presidential first years with positive 5-day performance. Based on the 5-day indicator, I think it is safe to say that 2017 should follow, or at least rhyme, with the blue forecast shown in the chart below.
I have identified four key points (A-D) in the chart which layout a pseudo roadmap for the coming year. The current rally should top out sometime between next week and early February at point A. That top will be followed by a correction to point B in late Feb to early March. The correction low at point B should be bought for an extended, and perhaps relentless, rally into point C in early October. Almost the entire gain for the year could be captured between points B and C. After peaking at point C, take profits and an early vacation as the market moves sideways for the remainder of the year from points C to D.
So far, there are only nine data points for 2017, which are plotted in yellow in the chart. Although it is still early yet, 2017 seems to tracking the blue forecast quite nicely. Let's hope that continues. ![]()
As always, do you own analysis and never rely on a single forecast or indicator.


