This morning the market is pushing much higher on much lighter volume...
Which type of behavior do you think this is?
There are only 2 choices
PLEASE VOTE...
Thank You...

Volume Dynamics Specialist
Posted 12 February 2018 - 11:33 AM
This morning the market is pushing much higher on much lighter volume...
Which type of behavior do you think this is?
There are only 2 choices
PLEASE VOTE...
Thank You...
Volume Dynamics Specialist
Posted 12 February 2018 - 12:35 PM
Please Vote...
Let's find out who is thinking what...
Thanks...
And the reason that we don't have a choice for NEUTRAL is simply because
That Ain't happening...
![]()
Edited by SemiBizz, 12 February 2018 - 12:37 PM.
Member

Posted 12 February 2018 - 02:19 PM
I say neither...it's a short covering rally after an extended decline that produced a deeply "oversold" (divergent) condition.
The rubber band on a propeller airplane can only be wound so far before its energy needs to be released.
Fib
Edited by fib_1618, 12 February 2018 - 02:38 PM.
Better to ignore me than abhor me.
“Wise men don't need advice. Fools won't take it” - Benjamin Franklin
"Beware of false knowledge; it is more dangerous than ignorance" - George Bernard Shaw
Demagogue: A leader who makes use of popular prejudices, false claims and promises in order to gain power.
Technical Watch Subscriptions
Volume Dynamics Specialist
Posted 12 February 2018 - 02:39 PM
I say neither...it's a short covering rally after an extended decline that produced a deeply "oversold" (divergent) condition.
The rubber band on a propeller airplane can only be wound so far before its energy needs to be released.
Fib
So are you a bull or a bear here?
Sounds like you might be bearish...
![]()
Member
Posted 12 February 2018 - 03:11 PM
I say neither...it's a short covering rally after an extended decline that produced a deeply "oversold" (divergent) condition.
The rubber band on a propeller airplane can only be wound so far before its energy needs to be released.
Fib
So are you a bull or a bear here?
Sounds like you might be bearish...
Right now I'm neutral...there's not enough information as yet to make a short term call.
Intermediate to longer term, however, the path of least resistance remains higher.
Fib
Better to ignore me than abhor me.
“Wise men don't need advice. Fools won't take it” - Benjamin Franklin
"Beware of false knowledge; it is more dangerous than ignorance" - George Bernard Shaw
Demagogue: A leader who makes use of popular prejudices, false claims and promises in order to gain power.
Technical Watch Subscriptions
Volume Dynamics Specialist
Posted 12 February 2018 - 03:32 PM
Well, this is going to be good TREND information...
Nasdaq went up on MUCH LIGHTER VOLUME today...
So we'll see if it's sustainable... or if we get another HIGH VOLUME and VELOCITY SMACK DOWN...
Hoping for an EXTREME close here on the high today...
Member

Posted 12 February 2018 - 03:34 PM
The only metric that we’ve discussed so far in this tutorial is the price, but there are other non-price factors that are equally as important – including volume.
What is Volume?Volume is simply the number of shares or contracts that trade over a given period – usually a day. Often times, volume is expressed as a bar chart directly below the price chart with the bars height illustrating how many shares have traded per period. Volume charts can also be analyzed to show trends of increasing or decreasing volume over time. (For further reading, see Price Patterns – Part 3, Gauging Support and Resistance with Price by Volume).
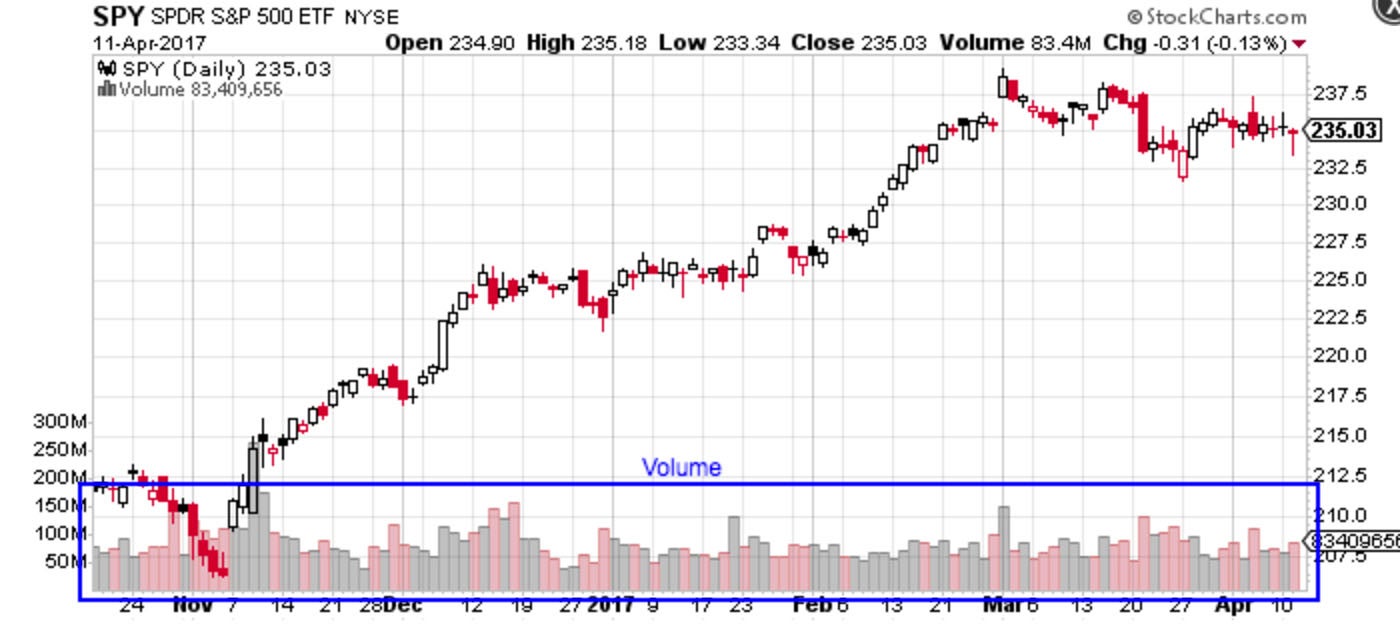
Figure 8 – Volume on Chart – Source: StockCharts.com
Why Volume is Important?Volume is used by technical analysts to confirm trends and chart patterns. The strength of any given price movement is measured primarily by the volume. In fact, a 50% rise in a stock price may not be all that relevant at all if it occurs on very little volume – just look at penny stocks.
For example, suppose that a stock jumps 5% in one trading day after being in a long-term downtrend. Is this a reversal of the long-term trend? The answer depends on whether there was a substantial amount of volume behind the move. If the volume was below average, the move was likely a fluke and the downtrend is likely to continue. On the other hand, if the volume was significantly higher than average, then it could be the start of a reversal. (To read more, check out Trading Volume – Crowd Psychology).
In addition to single day moves, the trend in volume over time can be related to price trends to determine if a stock is gaining or losing momentum. An example might be a stock that has been trending higher with declining volume, which suggests that the rally may be losing momentum. In that case, traders may want to be on the lookout for a reversal and perhaps reduce or sell their long positions in preparation. This is known as divergence. (For additional insight, read Divergences, Momentum, and Rate of Change).
Volume and Chart Patterns
Volume is invaluable when confirming chart patterns, such as head and shoulders, triangles, flags, and other patterns. These chart patterns will be discussed in greater detail later on, but for now, know that chart patterns try to predict pivotal moments – like reversals. If volume isn’t present alongside these chart patterns, then the resulting trading signal isn’t as reliable.
Volume Precedes Price
A final important concept to understand is that price is preceded by volume. Technical analysts closely watch volume to see when reversals are likely to occur, which means that volume changes can be a precursor to price changes. If volume is decreasing in an uptrend, it could signal that the uptrend is coming to a close and a reversal may be likely.
Member

Posted 12 February 2018 - 09:08 PM
Neither...no evidence that was THE top nor are we in a bigger picture downtrend. All we did so far was take the excess out of a ridiculously extended market. Two reference points that matter now:
50d MA 2720 resistance
200d MA 2540 support
Its a great traders market until we see more, no need to be a big bull or bear.
http://stockcharts.c...id=p49834367336
Edited by tommyt, 12 February 2018 - 09:11 PM.
Member
Posted 12 February 2018 - 11:36 PM
Member

Posted 13 February 2018 - 12:13 AM
I think we'll get volume tomorrow or latest by day after.


