My Short term trend turned up today at SPX 2743. Now all the trends ST, IT and LT are up. FWIW.

Bullish
Started by
NAV
, Jun 27 2018 09:41 AM
12 replies to this topic
#2

trioderob
-

- Traders-Talk User
- 1,295 posts
Member
Posted 27 June 2018 - 10:22 AM
even with the Emerging markets in an extreme downtrend ?

#4
alexnewbee
-

- Traders-Talk User
- 1,459 posts
Member
Posted 27 June 2018 - 12:21 PM
Buy first bottom and get second one as present.
It was a trap, looks like.
It was a trap, looks like.
"we do G.d's work" Lloyd Blankfein
#5
trioderob
-
- Traders-Talk User
- 1,295 posts
Member
Posted 27 June 2018 - 12:28 PM
the emerging markets are massively down over that last month - that's not a good thing for US markets anymore
#6
OEXCHAOS
-

- Admin
- 22,021 posts
Mark S. Young
Posted 27 June 2018 - 03:19 PM
I'm liking this weakness. I think it's setting up a nice rally.
Mark
Mark S Young
Wall Street Sentiment
Get a free trial here:
http://wallstreetsen...t.com/trial.htm
You can now follow me on twitter
#7
tsharp
-

- Traders-Talk User
- 1,487 posts
Member
Posted 27 June 2018 - 05:14 PM
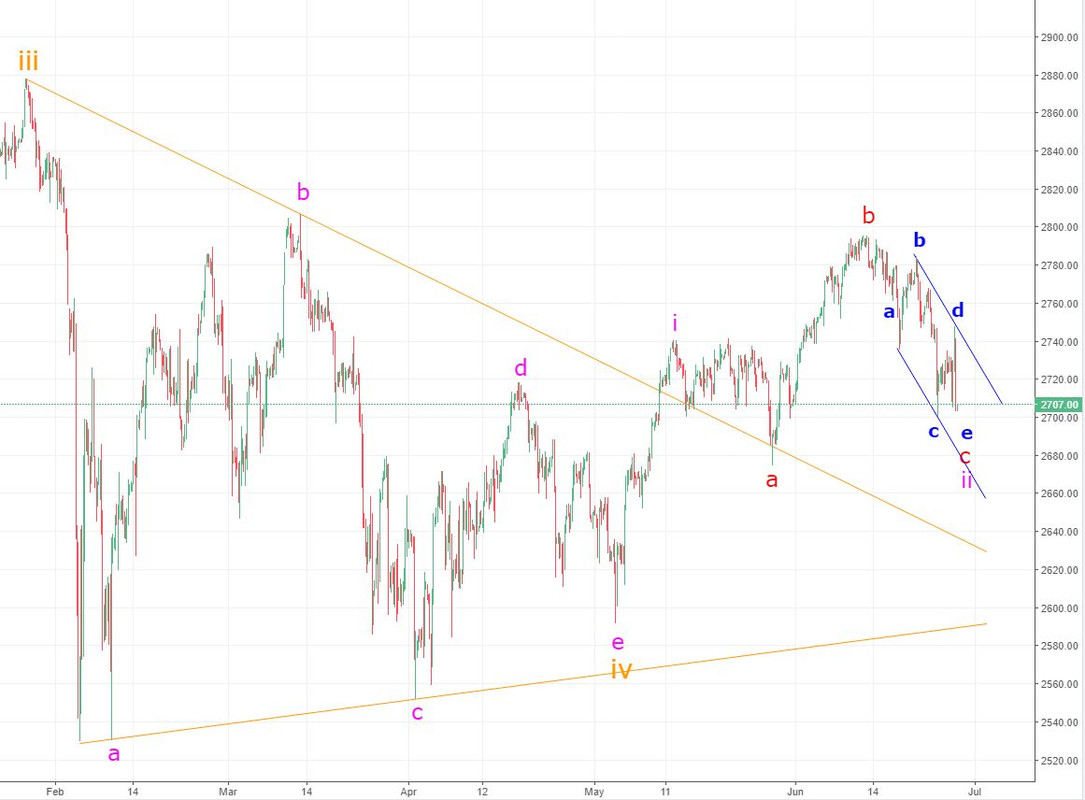
What a day... but to get in both the d-wave and e-wave, a lot of volatility was necessary...
As I see it, wave-c:ii is nearly compete, then upward in wave-iii to the ~3000 range...
From this morning's IG update @milehighstrategies :
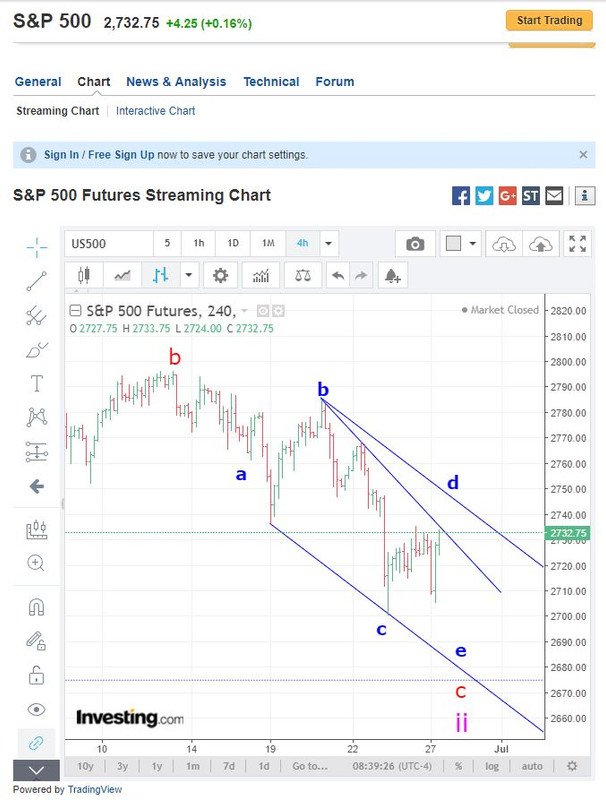
Link to chart: https://postimg.cc/image/oax6jn0a1/
From the close:
Link to chart: https://postimg.cc/image/uom9mwkll/
#8
OEXCHAOS
-
- Admin
- 22,021 posts
Mark S. Young
Posted 27 June 2018 - 11:30 PM
I made money on the long side, but it wasn't easy.
M
Mark S Young
Wall Street Sentiment
Get a free trial here:
http://wallstreetsen...t.com/trial.htm
You can now follow me on twitter
#9
qqqqtrdr
-

- Traders-Talk User
- 3,220 posts
Member
Posted 28 June 2018 - 11:27 AM
Eventually we will have a good bottom coming along, but the market is still a little over valued even considering the strong growth, but not bad... The problem I see coming is the increased interest rates will slow spending and put a damper on the economy... We have not seen this yet, with GDP growth at 4%, and new home sales up 10%. Lower interest rates has caused Household debt per GDP to drop, but have stabilized over the last couple quarters due to higher interest rates and increased GDP growth.... A drop in the market could slow spending and start a snowball affect. I'm keeping my eye out for signs if the market drops further.. Right now I'm not seeing signs that this will happen. Put/Call Ratios are signalling we have not yet reached a medium term bottom in the market.
#10
tsharp
-
- Traders-Talk User
- 1,487 posts
Member
Posted 28 June 2018 - 06:01 PM
What a day... but to get in both the d-wave and e-wave, a lot of volatility was necessary...
As I see it, wave-c:ii is nearly compete, then upward in wave-iii to the ~3000 range...
From this morning's IG update @milehighstrategies :
Link to chart: https://postimg.cc/image/oax6jn0a1/
From the close:
Link to chart: https://postimg.cc/image/uom9mwkll/
Too early to know whether today's low was a b-wave on the wave-e or the c-wave of the same... a rise above the channel top DTL would be a good start, and above the previous wave-d would pretty much seal the deal.
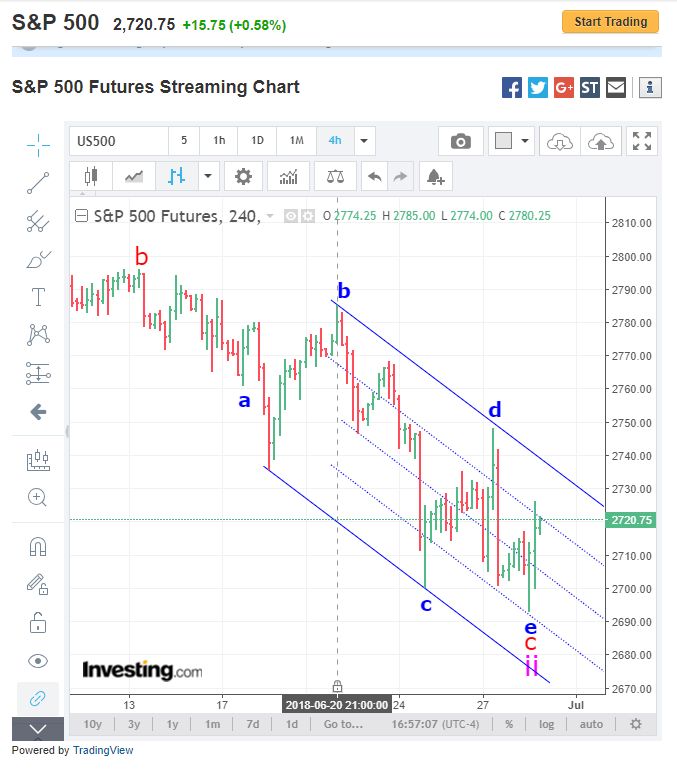
Link to chart: https://postimg.cc/image/oxwjsp6ft/


