Jump to content


Photo

Correction over - Part II


  • Please log in to reply
10 replies to this topic

#1 NAV

NAV

    Member

  • Traders-Talk User
  • 16,087 posts

Posted 02 August 2018 - 11:25 AM

Sometimes you need a gap to fill another gap. Today's gap-down filled the Jul 31 gap on the SPX cash.


If SPX closes above 2816 today, then the correction/consolidation is over and the next logical expectation would be new all time highs on the SPX.


Close above SPX 2816 is the key ! Will be watching with interest...


Edited by NAV, 02 August 2018 - 11:30 AM.

"It's not the knowing that is difficult, but the doing"


https://twitter.com/Trader_NAV


#2 OEXCHAOS

OEXCHAOS

    Mark S. Young

  • Admin
  • 22,022 posts

Posted 02 August 2018 - 12:17 PM

Nice work.


Mark S Young
Wall Street Sentiment
Get a free trial here:
http://wallstreetsen...t.com/trial.htm
You can now follow me on twitter


#3 NAV

NAV

    Member

  • Traders-Talk User
  • 16,087 posts

Posted 02 August 2018 - 03:02 PM

Thanks Mark. 


A positive close, heading into the Jobs numbers.


Edited by NAV, 02 August 2018 - 03:02 PM.

"It's not the knowing that is difficult, but the doing"


https://twitter.com/Trader_NAV


#4 hiker

hiker

    independent trader

  • TT Member*
  • 12,118 posts

Posted 02 August 2018 - 07:00 PM

SPX daily chart Link for those with StockCharts Pro level subscription -


https://stockcharts....651&a=604365819
 

summary of the cumulative Advance-Decline breadth lines:


8/02 - Advance-Decline line status:
* bullish uptrend by the A-D line remains intact for all listed below, while
the A-D line remains above the 19-day ema -


* note - some of the distances above the 19-day ema are small, and a lasting decline below the 19-day ema

will not require more than a day or two of negative A-D breadth to initiate a lengthy correction downward

for the Advance-Decline lines


* Cumulative A-D line pullbacks during bull markets often target the A-D lines' 50 day sma, and is what I consider

a customary expectation for even minor breadth and price pullbacks during an intermediate-term uptrend

S&P 500 A-D line - above the 19-day ema
S&P 100 A-D - above
NYSE common-stocks-only A-D - above, was below briefly
NYSE all issues A-D - above, was below briefly
Nasdaq 100 A-D - above, was below briefly
Dow Jones Industrial A-D - above
S&P 400 A-D - above
S&P 600 A-D - above


A-D lines chart source: Stockcharts.com


Edited by hiker, 02 August 2018 - 07:14 PM.


#5 tsharp

tsharp

    Member

  • Traders-Talk User
  • 1,487 posts

Posted 02 August 2018 - 09:02 PM

Sometimes you need a gap to fill another gap. Today's gap-down filled the Jul 31 gap on the SPX cash.


If SPX closes above 2816 today, then the correction/consolidation is over and the next logical expectation would be new all time highs on the SPX.


Close above SPX 2816 is the key ! Will be watching with interest...


Just another point of view... if this correct, tomorrow will be a reversal day... will be watching with interest...


SP00_Top_Filter.jpg


Link to chart:  https://postimg.cc/image/7hvarqo9z/


#6 ryanoo

ryanoo

    Member

  • Traders-Talk User
  • 660 posts

Posted 03 August 2018 - 08:29 AM

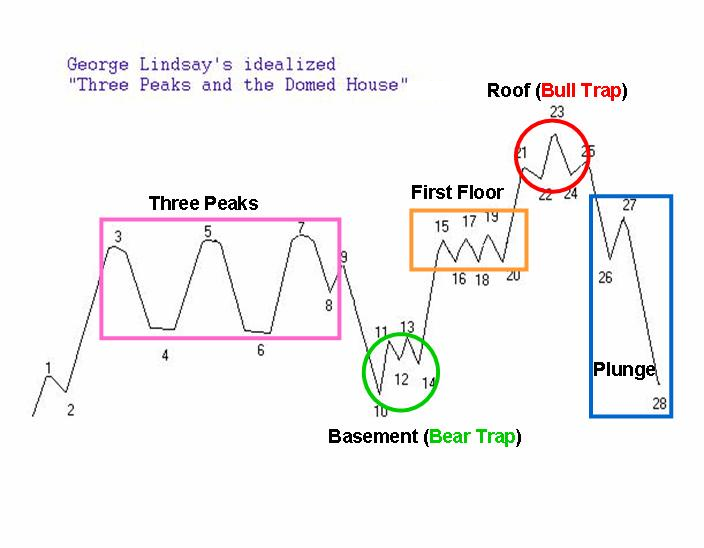
This chart pattern that CLK posted yesterday looks somewhat similar ...LOL

3pdm.png


#7 NAV

NAV

    Member

  • Traders-Talk User
  • 16,087 posts

Posted 03 August 2018 - 10:33 AM

SPX daily chart Link for those with StockCharts Pro level subscription -


https://stockcharts....651&a=604365819
 

summary of the cumulative Advance-Decline breadth lines:


8/02 - Advance-Decline line status:
* bullish uptrend by the A-D line remains intact for all listed below, while
the A-D line remains above the 19-day ema -


* note - some of the distances above the 19-day ema are small, and a lasting decline below the 19-day ema

will not require more than a day or two of negative A-D breadth to initiate a lengthy correction downward

for the Advance-Decline lines


* Cumulative A-D line pullbacks during bull markets often target the A-D lines' 50 day sma, and is what I consider

a customary expectation for even minor breadth and price pullbacks during an intermediate-term uptrend

S&P 500 A-D line - above the 19-day ema
S&P 100 A-D - above
NYSE common-stocks-only A-D - above, was below briefly
NYSE all issues A-D - above, was below briefly
Nasdaq 100 A-D - above, was below briefly
Dow Jones Industrial A-D - above
S&P 400 A-D - above
S&P 600 A-D - above


A-D lines chart source: Stockcharts.com


Hiker,


Long time, no see. Good to see you posting here.


Edited by NAV, 03 August 2018 - 10:34 AM.

"It's not the knowing that is difficult, but the doing"


https://twitter.com/Trader_NAV


#8 tsharp

tsharp

    Member

  • Traders-Talk User
  • 1,487 posts

Posted 03 August 2018 - 03:58 PM


Sometimes you need a gap to fill another gap. Today's gap-down filled the Jul 31 gap on the SPX cash.


If SPX closes above 2816 today, then the correction/consolidation is over and the next logical expectation would be new all time highs on the SPX.


Close above SPX 2816 is the key ! Will be watching with interest...


Just another point of view... if this correct, tomorrow will be a reversal day... will be watching with interest...


SP00_Top_Filter.jpg


Link to chart:  https://postimg.cc/image/7hvarqo9z/


I thought the top would be earlier in the day, but it didn't play out that way...  If this is correct, next week is down... twt.


SP00_15_8.3.18.jpg


#9 hiker

hiker

    independent trader

  • TT Member*
  • 12,118 posts

Posted 03 August 2018 - 10:25 PM

thank you for the welcoming greeting NAV.  I have kept up

with your blog content and your content posted here over the recent months & years.


I am interested in how the cumulative Advance-Decline breadth lines for the SPX, the NDX, and 

the NYSE common-stocks-only data set develop in the coming weeks and months.  I usually plot

for each cumulative Advance-Decline breadth line these Bollinger Band tools at a minimum:


50,2 BB

50,2 %B

50,2 BB Bandwidth


the Bandwidth since early July or since mid-July depending on the index whose

A-D line is being viewed reflects a lower period of A-D line volatility than seen for much

of 2018 as the A-D lines are not too distant from their upper Bollinger Band but also

not rising by enough distance to expand the Bollinger Band. 


The length of this

period of basing near but not above the upper level of the BB channel combined with the actual July/August 2018

value of the BB Bandwidth viewed in comparison to the Bandwidth highs and lows since 2016 is

somewhat striking in the Bandwidth comparison for the S&P 500 A-D line.  


I note that JAB's definition for Bandwidth incorporates an explanation that lower volatility periods

are followed by higher volatility periods.


So, we can use other tools to divine whether the Bollinger Band expansion that eventually next occurs for the S&P 500

cumulative A-D line is likely to take price action and the Advance-Decline line to new heights or back toward the BB

midline or lower.


Summary for status of A-D line BB Bandwidth using the daily 50,2 setting and using StockCharts.com as the data source:


S&P 500 - Bandwidth peaked in mid-June

Nasdaq 100 - Bandwidth peaked in late June

NYSE common-stocks-only - Bandwidth peaked in early June 2018


Edited by hiker, 03 August 2018 - 10:35 PM.


#10 larryh

larryh

    Member

  • Traders-Talk User
  • 21 posts

Posted 07 August 2018 - 06:52 AM

hiker,


thanks for the great analysis and posts !


question from a newbie like me - would you say the spx leads the upper BB higher or does the upper BB provide a significant resistance level for the spx? 


I have also noticed that the upper daily BB chart today is 2851, exactly where the spx is; however the weekly BB reflects an upper range of 2872 (the spx high earlier this year) - any insights into the spx hitting the weekly 2872 upper BB or is the daily BB upper range of 2851 more significant and possibly a bounce down (temporary) is in front of us?


Thanks ....