Jump to content


Photo

'The road to trading glory is littered with the bodies of those who tried to pick bottoms.' -- Carl Swenlin


  • Please log in to reply
17 replies to this topic

#1 dTraderB

dTraderB

    Member

  • Traders-Talk User
  • 17,212 posts

Posted 13 October 2018 - 03:33 PM

True. Catching falling knives can be quite painful - physically as well as in your bank account. 

Yet, one has to try to try to follow the market and quickly adjust when the market does turn

Then again, it all depends on your time frame. 


I still think we have seen the ST low in this move down but am not confident this rally will go much higher than SPX 2820 or even as high as SPX 2860, and the CRASH WINDOW is still open. 

The selling yesterday was fast & furious, intense, awesome, as every rally was sold down, until the bulls finally won and sent it higher; even so, the bears came in at the end and sent it down a few SPX points. 

The "fear" extremes are enough to generate a rally that can last a day or two, or three, but this move down seems to be in its early stages,  in terms of time. 


Here is Carl's article:

DP Weekly Wrap: Picking Bottoms
Carl Swenlin |  October 12, 2018 at 06:38 PM


"The road to trading glory is littered with the bodies of those who tried to pick bottoms."

       -- Carl Swenlin (once upon a bad day)

To use an expression made popular by the late Kennedy Gammage, bottom picking is for "swingin' riverboat gamblers." To be sure, it is a risky endeavor, but after Wednesday's bloodbath I suggested: For those who want to try to pick a bottom, the first short-term indication that a price bottom may be near will be when the daily PMO turns up. I wouldn't jump in until that happens. A daily PMO bottom is not a foolproof signal(see this for yourself by studying PMO bottoms on the charts), but it is at least one way to avoid pure guesswork, and waiting for it gives you an excuse to not act prematurely. Of course, tight stops and a commitment to execute them are part of the equation.


15393772848331593571159.png

 As you can see on the chart above, the daily PMO is not even hinting at a possible upturn. I think the price bottom in February is probably an example of what we might expect. It was a small but complex affair with the VIX climax occurring four days ahead of the price low.


https://stockcharts....g-a-bottom.html


#2 dTraderB

dTraderB

    Member

  • Traders-Talk User
  • 17,212 posts

Posted 13 October 2018 - 04:32 PM

Cliff Noreen, deputy chief investment officer at MassMutual also notes that the investment-grade and high-yield bond markets performed pretty well, relative to stocks. The iShares iBoxx $ Investment Grade Corporate Bond exchange-traded fund (ticker: LQD) gained 0.5% on the week, while the iShares iBoxx $ High Yield Corporate Bond ETF (HYG) dipped just 0.3%. The corporate credit sector wasn’t leading the equity markets lower, as it sometimes does.

That doesn’t mean the bull market is ready to resume its run, however. Doug Ramsey, chief investment officer of the Leuthold Group, thinks the Sept. 20 high for the S&P 500 of 2930.75 may well mark the peak for the year, and perhaps even for the historic run that began in March 2009.

For confirmation of that, he’s looking for a breakdown in the leadership themes that have defined this bull market: growth stocks over value; U.S. assets over foreign assets; financial assets over real assets; and the relative strength in momentum stocks, which, as Ben Levisohn writes in the Trader column, has already begun to break down. If those other three “paw prints” of the bear are sighted, the beast’s return will be confirmed, Ramsey concludes. 

https://www.msn.com/...loco/ar-BBOj4Kb


#3 PrintFaster

PrintFaster

    Member

  • Traders-Talk User
  • 1,683 posts

Posted 13 October 2018 - 10:03 PM

Usually there is a fakeout rally, then a retest, or lower low, lots of choppy action over the next 6 - 9 months to repair the damage if the market is going to go higher.


#4 Douglas

Douglas

    Member

  • Traders-Talk User
  • 1,828 posts

Posted 14 October 2018 - 01:43 AM

'The road to trading glory is littered with the bodies of those who tried to pick bottoms  tops.' -- The FED.  There, fixed it for you.


Regards,

Douglas


#5 dTraderB

dTraderB

    Member

  • Traders-Talk User
  • 17,212 posts

Posted 14 October 2018 - 08:34 AM

Agree, picking tops or bottoms has not proven to be profitable


#6 dTraderB

dTraderB

    Member

  • Traders-Talk User
  • 17,212 posts

Posted 14 October 2018 - 08:36 AM

Usually there is a fakeout rally, then a retest, or lower low, lots of choppy action over the next 6 - 9 months to repair the damage if the market is going to go higher.


Haven't spent time on this so am asking:  what stocks do you think will give the best returns after the lows are in? Just a few names....


#7 dTraderB

dTraderB

    Member

  • Traders-Talk User
  • 17,212 posts

Posted 14 October 2018 - 08:37 AM

The Stock Market Rout: A Healthy Correction, Or The Start Of A Bear Market?


Is a bear market beginning?

The stock market was pummeled in a two-day stretch from Oct. 10-11, with major indexes tumbling across the globe. This has led many investors to wonder if the much-anticipated beginning to the next bear market is underway. Goff's answer? Probably not.

"The recent downturn looks a lot more like the market correction that occurred in early February, following January's peak in equities," he stated. Looking at market moves so far this month, stocks appear to be retracing - or walking back - some of the excessive gains from the third quarter, Goff noted. Case in point: U.S. large-cap equities, as measured by the S&P 500® Index, were up approximately 7.5% last quarter, and are now down roughly 6.5% in October. Likewise, global equities (as measured by the MSCI World Index) advanced roughly 5% in the third quarter, and have now retreated by roughly the same amount.

"Essentially, we're seeing the market re-thinking its excitement over the past few months," Goff said, "with investors now realizing that perhaps there's more to be concerned about, especially in regard to the forward-looking economic outlook."

What drove the market plunge?

What factors behind the scenes may have led to this shift in thinking? Looking at the actual news from the week of Oct. 8, nothing in particular happened that should have triggered such a steep sell-off, Goff said. For instance, the release of the U.S. Bureau of Labor Statistics' Consumer Price Index (CPI) for September showed a 2.3% increase, year-over-year. While that was slightly below consensus expectations, it wasn't enough to set off a firestorm of concern, he remarked.

In Goff's mind, in order to really assess what happened in markets, it's best to take a step back and look at things from a broader perspective. Last year was an extraordinary year for markets, he said, with stocks consistently churning upward. Ever since this year's January high-water mark, in Goff's opinion, a very different sort of market environment has set in, "a push-and-pull between concerns about how high interest rates will climb, when inflation will become a problem and whether trade tensions between the U.S., China and other countries will impact economic growth rates."


These issues have all surged to the forefront in the past few weeks, Goff said, likely indicating that the remainder of 2018 will be plagued by higher volatility across markets. While there will be a bear market at some point in the future, he reiterated that the recent slide is likely not indicative of its beginning.

Is volatility here to stay?

https://seekingalpha...ar-market?ifp=0


#8 dTraderB

dTraderB

    Member

  • Traders-Talk User
  • 17,212 posts

Posted 14 October 2018 - 08:40 AM

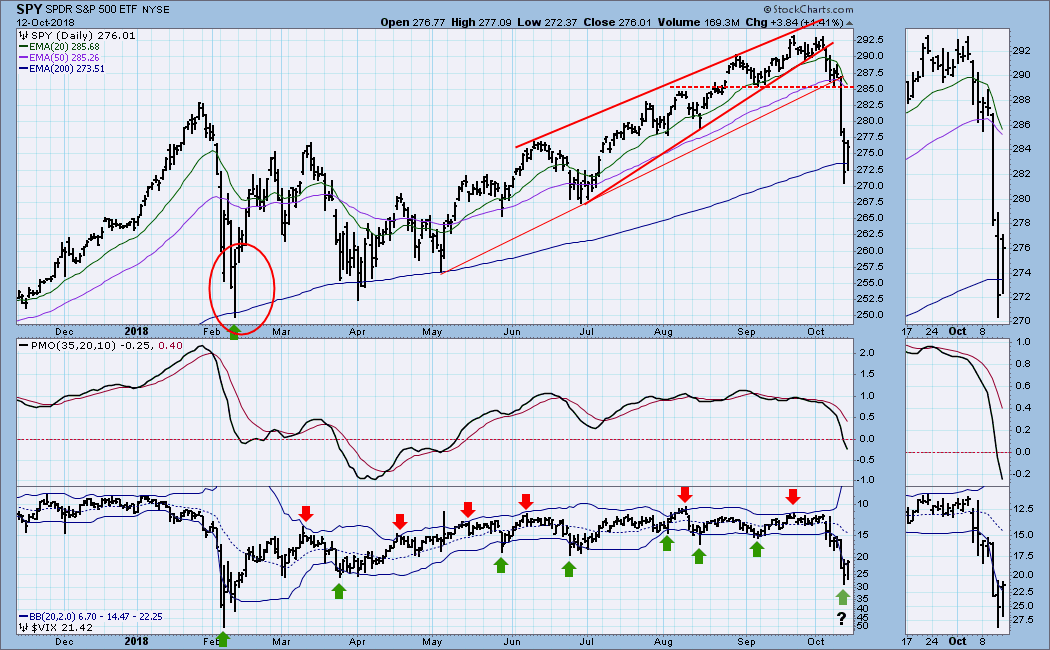
Maybe, but it will help the bear case if the market rallies another 1 or 2% and then retest last week's lows. 


On Friday afternoon, the recognized authority on these matters, JPMorgan's Marko Kolanovic, weighed in on the selloff, and in the absence of a compelling reason to think otherwise, his take should probably be viewed as the definitive assessment. Here is a quick excerpt from Marko's note that explains what happened:

Wednesday’s selloff was largely technical in nature, with systematic strategies following the same selling template as in the Feb 5th selloff. Fundamental fears this time were about rising yields and the Fed’s more hawkish stance. In terms of systematic strategies that drove the selloff – by far the biggest selling pressure was from option gamma hedging on Wednesday.

What you should note about this is that some of it isn't debatable. There's math behind these assessments of systematic selling pressure, so while smart people can argue about "how much" and "who" (where "who" just means which systematic strats were primarily responsible for accelerating the declines), explanations that don't reference these flows are incomplete. Period.


There's some debate about the scope of CTA selling on Wednesday. In a post published here on Thursday, I cited an estimate from Nomura that put the figure at $88 billion. Since then, at least two reputable sources have told me that's not plausible. I don't know the answer, and I'm not going to pretend like I do.

What I do know, though, is that CTAs move quickly, so in the absence of another sharp move to the downside, that source of deleveraging has likely run its course. "[CTA selling] is likely largely behind us given the already low CTA equity beta, and the fact that 12M momentum on S&P 500 will most likely hold positive (>2550)", the above-mentioned Kolanovic wrote, in the same cited note.

So that takes care of option gamma hedging and the trend followers. But that still leaves the vol.-targeting crowd, and as you're probably aware, they are slower moving. This group includes risk parity, a strategy that leans heavily on leveraged bond positions and depends, at least in part, on the preservation of a negative stock-bond return correlation (positive equity-rates correlation). Do recall that a flip in the sign of that correlation was one of the key worries headed into this week.

Long story short, selling from that crowd may continue over the next week (give or take). Kolanovic's assessment is that 70% of the systematic selling is out of the way, with the remainder likely to come from vol.-targeting funds.

On that point, some commentary from Barclays' Maneesh Deshpande began making the rounds on Friday and I want to address it for readers here in a fashion that is devoid of any attempts to overplay things (i.e., in a way that doesn't paint his analysis in a needlessly bearish way).

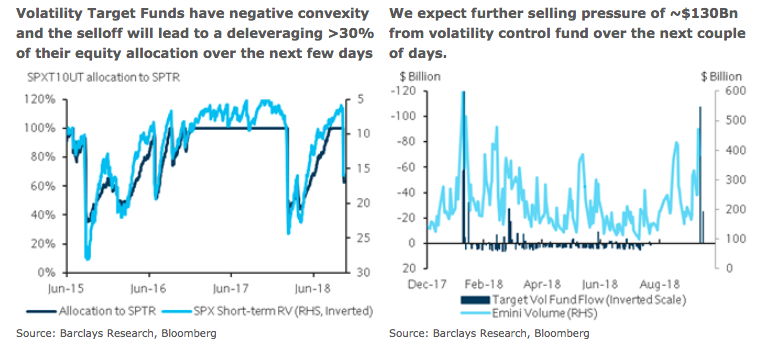
Deshpande, like Kolanovic, notes that the selling on Wednesday and Thursday followed the same template as February. That in part informs Deshpande's contention that another $130 billion in selling pressure from vol.-targeting funds may be in the cards.

Obviously, vol.-sensitive strats will deleverage during a volatility spike (in order to keep overall portfolio volatility steady). As expected volatility rises, they de-risk and while it's not possible to know, across funds, how everyone calculates expected volatility, Deshpande approximates things this way (from a note dated Thursday):


We estimate that the AUM in the Volatility control/Targeting strategies is ~$355Bn. We use the S&P Daily Risk Control 10% index as a benchmark strategy. This index rebalances between S&P exposure and cash to maintain a 10% volatility target. Until the past week the allocation according to the bench mark strategy was 100% to equities. With the sell-off the allocation has been reduced to ~65%.We expect further systematic selling to the tune of ~$130Bn from these funds to reduce allocation to equities over the next couple of days.

47439673-1539448394615485.png

In the same note, Deshpande also says some $40 billion in ETF selling could materialize over the same period.

Even if that does materialize, it's important to understand that, as mentioned above, selling from vol.-control funds is slower and takes place over longer windows. In other words, there's time for other flows to offset the selling pressure - flows like buying from discretionary investors and folks hunting for "bargains" amid the drawdown.

That doesn't mean further systematic deleveraging won't lead to a "second leg lower" (as Deshpande suggested in the Thursday note cited above). But it does mean the market may be able to absorb those flows.

In a Friday morning post for this platform, I mentioned that we're in "peak buyback blackout" right now. I thought I was being charitable with that characterization to the extent it offered a ray of sunshine for bulls (i.e., a way to rationalize the Wednesday/Thursday selling and a positive read-through for equities once the blackout rolls off).

Invariably, some readers pointed out that buybacks aren't absent altogether during blackout periods. That's something I mentioned over on my site this week on at least two occasions, but I didn't want to raise it on this platform primarily because had I mentioned it, it would have taken the form of "well, even buybacks weren't enough to save you on Wednesday". But since it's since come up, I'll go ahead and address it.


In his Friday note, Kolanovic writes that going forward, buybacks might be one of the sources of equity demand that helps offset any further deleveraging from vol.-targeting funds. "ASR programs [are] not subject to blackouts", Marko wrote.

Well, on Wednesday, Goldman's buyback desk saw its largest flow since the February rout:
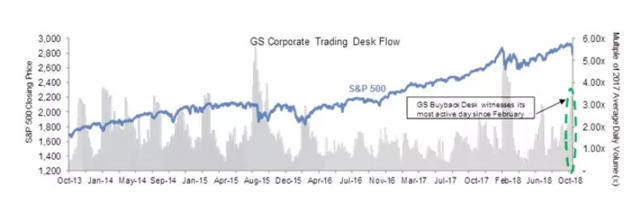
47439673-15394491197387912.png(Goldman)

This is both good and bad. On the positive side, it means the buyback "safety net" is not completely absent. On the negative side, the fact that it "wasn't enough" (if you will) on Wednesday and Thursday suggests that in the face of rapid systematic deleveraging, there's little that can be done.

It's also worth noting that on Friday afternoon, in his latest note, JPMorgan's Nikolaos Panigirtzoglou flagged further risks to stocks including still elevated leverage in retail margin accounts and an under-hedged institutional crowd. But his analysis looks less geared towards addressing further pressure from systematic selling and more towards flagging the same set of ongoing risks he usually brings up, including in last week's note when he talked about the exact same margin account balances.
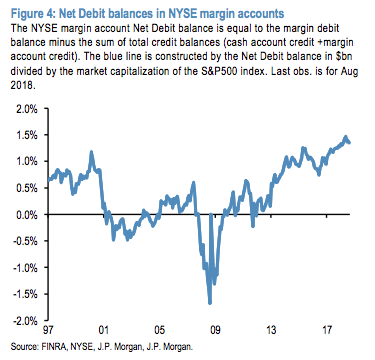
47439673-15394496968352504.png(JPMorgan)

If you're wondering what Goldman thinks, the bank reminded folks on Friday that these types of drawdowns are by no means uncommon and in fact, this one came right on schedule (almost to the day). To wit:

https://seekingalpha...ff-really?ifp=0


#9 dTraderB

dTraderB

    Member

  • Traders-Talk User
  • 17,212 posts

Posted 14 October 2018 - 09:02 AM

US Consumer Sentiment is still quite strong, though down a touch from the last print. If the stock market (and perhaps more importantly, the real estate market) were to give up some gains, that might change. Essentially, there may be a chicken-and-egg relationship here between consumer sentiment and asset values.

Thoughts on Volatility

48084227_15393834735815_rId8.png

As a general rule, you can pretty much find any relationship you decided you want to find. That's true of politics, life, and markets. Through the lens of the last year, the last week appears to have met up with a rather bizarre trend line. From the vantage point of the past few months, the past week was truly spectacular.

It is my opinion that where the VIX goes from here will be mostly dictated by intraday volatility and not so much by close-close measures, as they can mask meaningful risk (as they did the week ended Oct 5).

48084227_15393834735815_rId9.png

I like how succinct this opinion and step-by-step map to recovery are, but it perhaps ignores just how good we've had in the US as it concerns volatility over the past several years… remember spot VIX 19.5 is close to the since-inception average, which includes thousands of data points.


The "most hated bull" was a bull market built on low volatility. That is to say that I truly do not believe this bull market can forge new highs with VIX at average, or even near-average, levels.

That isn't to say the bull is over as such, only that it may take a while before we get this past week out of our system.

48084227_15393834735815_rId10.png

Beware interest rate arguments: they are ubiquitous these days ("markets do well in rising rate environments"). The reality is that the response to the GFC was largely about taking debt off the private sector and reassigning it through various channels to the public sector: the National Debt is very high… and as such our economy will likely not be as receptive to rising rates.


#10 dTraderB

dTraderB

    Member

  • Traders-Talk User
  • 17,212 posts

Posted 14 October 2018 - 08:44 PM

Watching the markets since the 6pm EST open and with good trading action decided to scalp a few NQ points. 4 trades, 3 winners, 1 loss. 


SPY-2.png?resize=676%2C431&ssl=1

"....This is just technically plain ugly as trend line after trend line keeps breaking to the downside.

Indeed the damage is so severe that 3.5 months of relentless summer buying was wiped out in a matter of days......

......The main message for markets: It’s a key time here because the potential consequences of a technical breakdown are severe and let me give you one chart to highlight this, the larger market index, the $VTI:......The bullish argument: Hey, we just tagged the 200 day moving average and look how magically we closed Friday again above it:......."


SPX200-1.png?ssl=1