The stock market, lol

The hardest way to make an easy living
Started by
saltlake
, Dec 26 2018 02:11 PM
4 replies to this topic
#2

flyers&divers
-

- TT Patron+
- 1,106 posts
Member
Posted 26 December 2018 - 02:50 PM
May I differ?
Actually it's not so bad if one has arranged to trade full time (or after Europe gets busy around 3 am EST)
With the amazing liquidity, cheap commissions and the greatest tools today it is just a matter of time one would find one's groove.
Open up an IB platform, set it to 15 second bar and a few canned indicators and follow the stock index futures ES or the Crude Oil futures CL for a couple of hours and there will be more tradable setups in a morning then in a full year utilizing daily charts.
Best regards,
F&D
Edited by flyers&divers, 26 December 2018 - 02:51 PM.
"Successful trading is more about Sun Tzu then Elliott." F&D
#3
fib_1618
-

- Traders-Talk User
- 10,145 posts
Member
Posted 26 December 2018 - 03:15 PM
Posted yesterday:
Since StockCharts (Decision Point) started keeping data on the McClellan Oscillator back to December of 1999, the following made new record low numbers on Monday:
NDX breadth MCO: -161
SPX breadth MCO: -174
OEX breadth MCO: -176
Dow breadth MCO: -189
Dow volume MCO: -176
MID volume MCO: -157
I don't know if these are all time lows or not, but we're now ridiculously "oversold".
Fib
Better to ignore me than abhor me.
“Wise men don't need advice. Fools won't take it” - Benjamin Franklin
"Beware of false knowledge; it is more dangerous than ignorance" - George Bernard Shaw
Demagogue: A leader who makes use of popular prejudices, false claims and promises in order to gain power.
Technical Watch Subscriptions
#4
tsharp
-

- Traders-Talk User
- 1,487 posts
Member
Posted 26 December 2018 - 03:27 PM
Posted yesterday:
Since StockCharts (Decision Point) started keeping data on the McClellan Oscillator back to December of 1999, the following made new record low numbers on Monday:
NDX breadth MCO: -161
SPX breadth MCO: -174
OEX breadth MCO: -176
Dow breadth MCO: -189
Dow volume MCO: -176
MID volume MCO: -157
I don't know if these are all time lows or not, but we're now ridiculously "oversold".
Fib
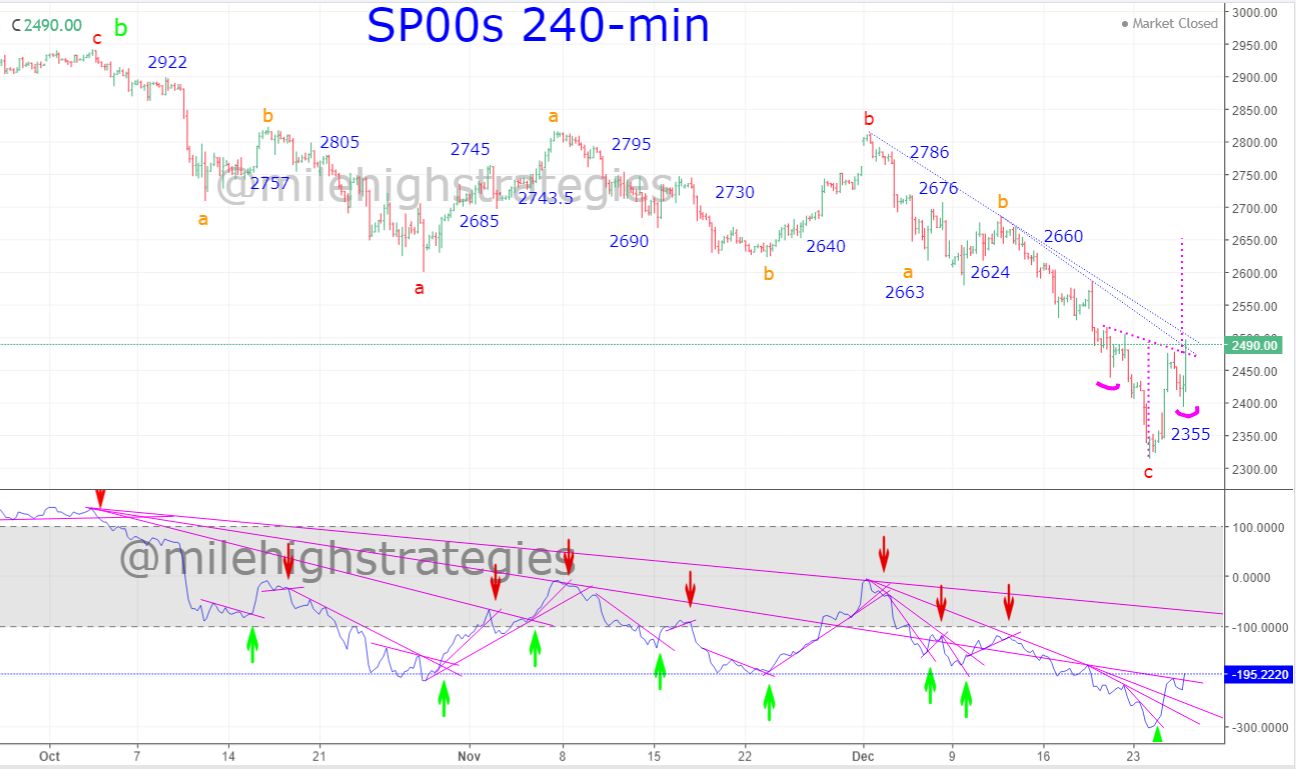
Yep, the risk was pretty low for a swing on the long side, even with the momentum signal so low... the 60-min chart was showing positive divergence against price, so the SAR went back to long on this morning's pullback...

#5
tsharp
-
- Traders-Talk User
- 1,487 posts
Member
Posted 27 December 2018 - 05:41 PM
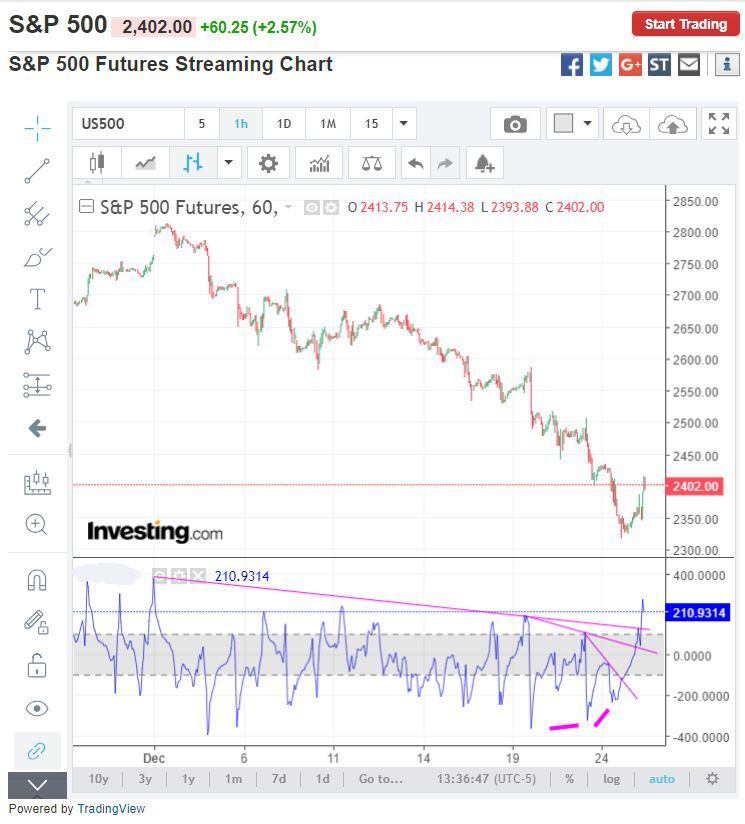
Today was what the momentum indicator suggested, a pullback, then a breakout... I'm looking for the next ST target to fulfill the RH&S target of ~2650... twt.