From WSJ:
Late-Day Rallies Add to Market Momentum
Such advances are boosting confidence in this year's rebound.
Stocks are rallying in the final hour of trading more often than normal, a bullish development for market watchers bruised by recent volatility.
The moments ahead of the stock market’s closing bell at 4 p.m. ET have grown in importance in recent years because index-tracking funds often depend on buying and selling shares using the day’s final price.
That leads to a flurry of trading, with 30% of daily volume on exchanges operated by the New York Stock Exchange and Nasdaq occurring in the last hour of the day, according to Dow Jones Market Data.
Analysts say the recent rallies at the busiest time of day are a positive indicator because they suggest strong investor demand for stocks.
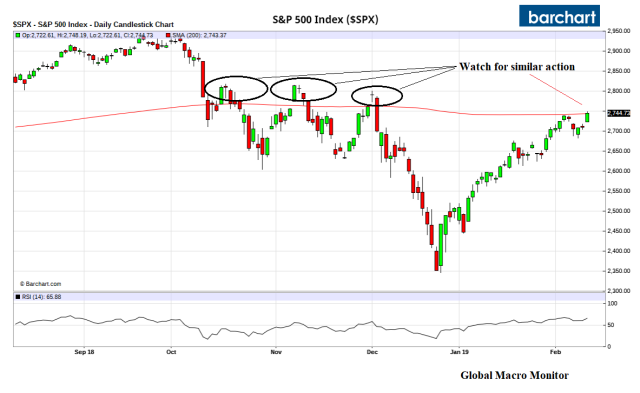
The S&P 500 climbed in the final hour of trading in eight consecutive sessions through Monday, the longest such streak in FactSet figures going back to Oct. 16, according to Dow Jones Market Data. Since falling to an 18-month low on Christmas Eve, the benchmark equity gauge has risen in the day’s last hour 76% of the time, compared with 57% of the time between Oct. 16 and Tuesday.
Such late-day moves have either extended rallies or limited the S&P 500’s drops, one of the factors analysts have credited with calming markets after last quarter’s dramatic swings.
“The moves we’re now seeing in the afternoons are helping build confidence,” said John Brady, managing director at brokerage R.J. O'Brien & Associates. “The most important hour of every trading day is the final hour.”
The S&P 500 averaged a 0.22% rise in the last hour of trading from Dec. 26 to Friday, according to Bespoke Investment Group analysts, its best performance in a single hour of the trading day during that stretch.
That’s nearly the opposite of what happened during the fourth-quarter selloff. Between Sept. 20 and Christmas Eve, stocks often opened higher before falling throughout the day and extending their declines in the final hour of trading.
The S&P averaged a 0.04% climb from 9:30 to 10 a.m., then fell in each remaining hour of the trading day, with a 0.06% decline on average in the day’s final hour, Bespoke’s analysis found.
Market Facts
- The proportion of fund managers surveyed by Bank of America Merrill Lynch that are overweight global equities is at its lowest level since September 2016, according to the monthly BAML fund manager survey. Being long emerging markets is the market's most crowded trade for the first time in the survey's history.
- With Monday's 1.6% rise, the S&P 500 industrials sector is up 16% so far this year, heading for its largest quarterly advance since 2011. The S&P's next-best performing group is the energy sector, which is up 11%.
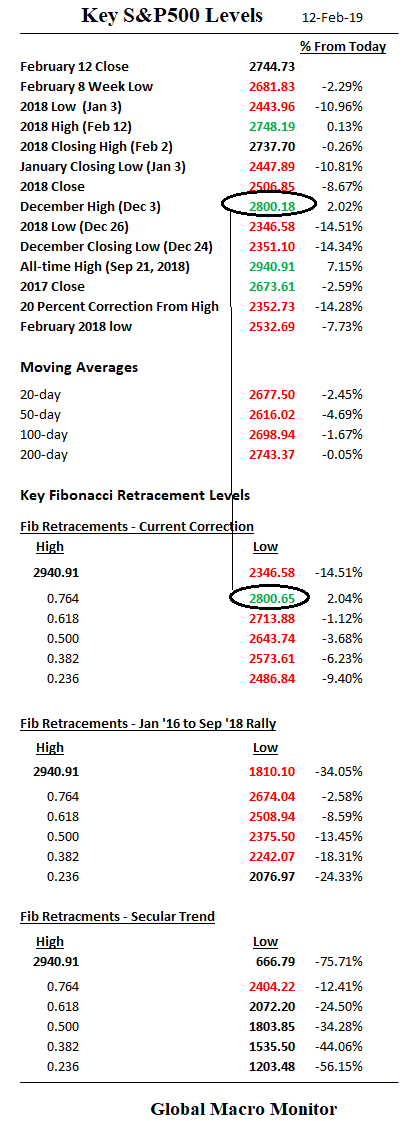
- The S&P 500 closed above its 200-day moving average for the first time since early December Monday, ending a 46-day streak without eclipsing the closely watched technical level. That marked its longest such stretch since March 2016, according to Dow Jones Market Data.
Late-Day Rallies Add to Market Momentum
Such advances are boosting confidence in this year's rebound.
Stocks are rallying in the final hour of trading more often than normal, a bullish development for market watchers bruised by recent volatility.
The moments ahead of the stock market’s closing bell at 4 p.m. ET have grown in importance in recent years because index-tracking funds often depend on buying and selling shares using the day’s final price.
That leads to a flurry of trading, with 30% of daily volume on exchanges operated by the New York Stock Exchange and Nasdaq occurring in the last hour of the day, according to Dow Jones Market Data.
Analysts say the recent rallies at the busiest time of day are a positive indicator because they suggest strong investor demand for stocks.
The S&P 500 climbed in the final hour of trading in eight consecutive sessions through Monday, the longest such streak in FactSet figures going back to Oct. 16, according to Dow Jones Market Data. Since falling to an 18-month low on Christmas Eve, the benchmark equity gauge has risen in the day’s last hour 76% of the time, compared with 57% of the time between Oct. 16 and Tuesday.
Such late-day moves have either extended rallies or limited the S&P 500’s drops, one of the factors analysts have credited with calming markets after last quarter’s dramatic swings.
“The moves we’re now seeing in the afternoons are helping build confidence,” said John Brady, managing director at brokerage R.J. O'Brien & Associates. “The most important hour of every trading day is the final hour.”
The S&P 500 averaged a 0.22% rise in the last hour of trading from Dec. 26 to Friday, according to Bespoke Investment Group analysts, its best performance in a single hour of the trading day during that stretch.
That’s nearly the opposite of what happened during the fourth-quarter selloff. Between Sept. 20 and Christmas Eve, stocks often opened higher before falling throughout the day and extending their declines in the final hour of trading.
The S&P averaged a 0.04% climb from 9:30 to 10 a.m., then fell in each remaining hour of the trading day, with a 0.06% decline on average in the day’s final hour, Bespoke’s analysis found.
Market Facts
- The proportion of fund managers surveyed by Bank of America Merrill Lynch that are overweight global equities is at its lowest level since September 2016, according to the monthly BAML fund manager survey. Being long emerging markets is the market's most crowded trade for the first time in the survey's history.
- With Monday's 1.6% rise, the S&P 500 industrials sector is up 16% so far this year, heading for its largest quarterly advance since 2011. The S&P's next-best performing group is the energy sector, which is up 11%.
- The S&P 500 closed above its 200-day moving average for the first time since early December Monday, ending a 46-day streak without eclipsing the closely watched technical level. That marked its longest such stretch since March 2016, according to Dow Jones Market Data.