Jump to content


Photo

TRADE WAR jitters scare BULLS, bearish Daily Candle


  • Please log in to reply
21 replies to this topic

#1 dTraderB

dTraderB

    Member

  • Traders-Talk User
  • 17,455 posts

Posted 19 March 2019 - 04:54 PM

But many more are watching that tantalizing march upward by the daily 50-ma (cyan) as it nears the 200ma  (magenta)


Since the 200ma is almost horizontal and moving much more slowly it is the 50ma that is making the more pronounced move up. 


I am leaning towards the theory that the markets will decline by more than 5% ONLY when the 50maa crosses or kisses the 200ma..... yep, that's why it is merely a theory and not based on even a grain of serious intellectual analysis.


 That's about the most bearish daily candle in two weeks, somewhat like the classic bearish SPINNING TOP pattern 
But, I don't bother with names of candlesticks since I am more interested in what the candle really means or signify rather than its name, Price Action, the range of the bar, the high, the low, the close, where are these located relative to each other and the previous candle etc. Every candle in daytrading is analyzed in that way...


This factoid:


@OddStats
FollowFollow @OddStats
More

$SPX hits 2850 for the first time since Oct 10, 2018. This round, arbitrary number holds no significance whatsoever, no matter what your constellation charts tell you.


55575963_10156699578535783_5585529840880


Edited by dTraderB, 19 March 2019 - 04:57 PM.


#2 dTraderB

dTraderB

    Member

  • Traders-Talk User
  • 17,455 posts

Posted 19 March 2019 - 04:55 PM

funny. 


@OddStats
FollowFollow @OddStats
More


D2Cc1LhU4AA4g9m.png
10:30 AM - 19 Mar 2019


#3 dTraderB

dTraderB

    Member

  • Traders-Talk User
  • 17,455 posts

Posted 19 March 2019 - 04:59 PM

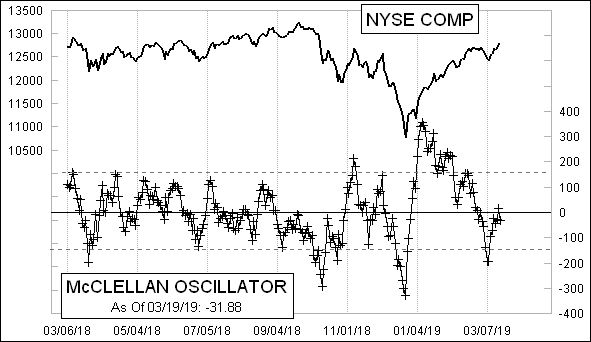
Back below zero

McClellanOsc_501.gif


but the others look Bullish:

https://www.marketin...summation-index


#4 dTraderB

dTraderB

    Member

  • Traders-Talk User
  • 17,455 posts

Posted 19 March 2019 - 05:07 PM

@hmeisler
FollowFollow @hmeisler
More

DJIA Golden Cross today. Where are the bulls on this?????

2:18 PM - 19 Mar 2019
Worst day for Transports since 1/22


#5 dTraderB

dTraderB

    Member

  • Traders-Talk User
  • 17,455 posts

Posted 19 March 2019 - 05:08 PM

@zerohedge

FollowFollow @zerohedge
More

Dec 19, 2018: FedEx issues "jarring" warning, suggesting "severe global recession" - stocks tumbles then quickly rebounds, company must be exaggerating


March 19: Fedex issues "stark" warning, saying "Slowing economic conditions and weaker global trade growth trends continue"

1:42 PM - 19 Mar 2019
 
 
FollowFollow @DougKass
More

After the close Federal Express misses and lowers guidance - underscoring the points I highlighted in my this morning's opening missive, "The Message of the Bond Market Goes Ignored." https://realmoney.thestreet.com/dougs-daily-diary?published[value][date]=2019-03-19&author=All#the-message-of-t-20190319  $FDX shares are trading -$10 in after hours.


Edited by dTraderB, 19 March 2019 - 05:09 PM.


#6 dTraderB

dTraderB

    Member

  • Traders-Talk User
  • 17,455 posts

Posted 19 March 2019 - 06:02 PM

The BAR CHART overlaid on the SPX is the daily VIX

That GREEN bar today looks like a BULLISH ENGULFING one but that does not mean it's a sure thing VIX will zoom up from here on.


Still need another 1 or 2% on the VIX to get a DAILY VIX buy


55575963_10156699578535783_5585529840880


Edited by dTraderB, 19 March 2019 - 06:04 PM.


#7 robo

robo

    Member

  • Traders-Talk User
  • 1,217 posts

Posted 19 March 2019 - 08:52 PM

"Still need another 1 or 2% on the VIX to get a DAILY VIX buy"


Historically tomorrow is a bad day for stocks, and the week after March option expiration has been down for the last seven years. Held some TZA for tomorrow......  (Beer Money trade/ Risk Management)   I still have some VXXB too.  The trade is based on a set of odds only.... My VST signal went to a sell at the close, but the daily is holding.....  We shall see what tomorrow brings....


Good luck on your trades....


Waiting to see how this data plays out.... (Reversal)  My system is close, and I respect his data.....  His LOLR remains up and so does my daily signal..... However, I agree with the comment below, but only trade the signals. Sometimes I sure don't want to stay long, but I do....


7 PM, March 19, 2019 Reversal


I agree with Thomas, but I still have NO SELL signal on my daily so the trend remains up....


  1.  

    This market does not deserve to trade one nickel above those 12/3 highs... built on Bull [bleeeep].

    2 replies1 retweet11 likes
    Reply
     2

Edited by robo, 19 March 2019 - 09:01 PM.

“There is only one side to the stock market; and it is not the bull side or the bear side, but the right side”   Jesse L. Livermore


#8 robo

robo

    Member

  • Traders-Talk User
  • 1,217 posts

Posted 19 March 2019 - 09:07 PM

So my daily trading eyes remains (VST/Daytrading) focused on the VIX and I will be trading VXXB and TZA/TNA...  currently long TZA.


Since we are talking about the VIX

Heat map for your consideration. Potential cup & handle in the works Weekly $VIX chart.


LOL.... I don't use this meter. The trend remains up until it's not. Still NO CONFIRMED reversal on the daily even though the 60 minute has....


https://stockcharts....596&a=652877568


Good Trading!


For the record: I'm not Bullish or Bearish.  I just trade the signals and the data I use based on a set of odds....  Ever play Blackjack?  That is how I VST trade. VST/Daytrading is gambling, and I want to be clear that I'm a very good BlackJack player. 


My 401k funds I only use VXF at Vanguard and the trades are free whenever I want as often as I want if I have the settled funds, and I always have LOTS of cash to trade with....


Edited by robo, 19 March 2019 - 09:16 PM.

“There is only one side to the stock market; and it is not the bull side or the bear side, but the right side”   Jesse L. Livermore


#9 robo

robo

    Member

  • Traders-Talk User
  • 1,217 posts

Posted 19 March 2019 - 09:22 PM

I trade GDXJ too, but that's not for this forum....


https://stockcharts....070&a=651173834


Those trades also happen at Vanguard since they are now free. However, no leveraged or short funds allowed.  Buy and sell as often as you like as long as you have the settled funds...


Time for a Michelob Ultra!


Good Trading....


Edited by robo, 19 March 2019 - 09:25 PM.

“There is only one side to the stock market; and it is not the bull side or the bear side, but the right side”   Jesse L. Livermore


#10 dTraderB

dTraderB

    Member

  • Traders-Talk User
  • 17,455 posts

Posted 19 March 2019 - 09:26 PM

So my daily trading eyes remains (VST/Daytrading) focused on the VIX and I will be trading VXXB and TZA/TNA...  currently long TZA.


Since we are talking about the VIX

Heat map for your consideration. Potential cup & handle in the works Weekly $VIX chart.


LOL.... I don't use this meter. The trend remains up until it's not. Still NO CONFIRMED reversal on the daily even though the 60 minute has....


https://stockcharts....596&a=652877568


Good Trading!


For the record: I'm not Bullish or Bearish.  I just trade the signals and the data I use based on a set of odds....  Ever play Blackjack?  That is how I VST trade. VST/Daytrading is gambling, and I want to be clear that I'm a very good BlackJack player. 


My 401k funds I only use VXF at Vanguard and the trades are free whenever I want as often as I want if I have the settled funds, and I always have LOTS of cash to trade with....


Looking forward to the next time VXF goes on a buy.... let me know .

Of course, it could be weeks or months from now since VXF is on a buy and has to go to a sell and then back again on a buy. Want to buy some

for an IT trade at that time


SPX solidly up, needs a break below 2809 to go on an IT sell (my system is basically based on True High, Low, Close, and True Range Moving Average with a VIX factor. Nothing fancy, just purely range and volatility.