Jump to content


Photo

SPX Golden Cross: catalyst to NEW HIGHS?


  • Please log in to reply
26 replies to this topic

#11 dTraderB

dTraderB

    Member

  • Traders-Talk User
  • 17,455 posts

Posted 30 March 2019 - 03:21 PM

You can read why he concludes this, at the the link below.


Conclusion

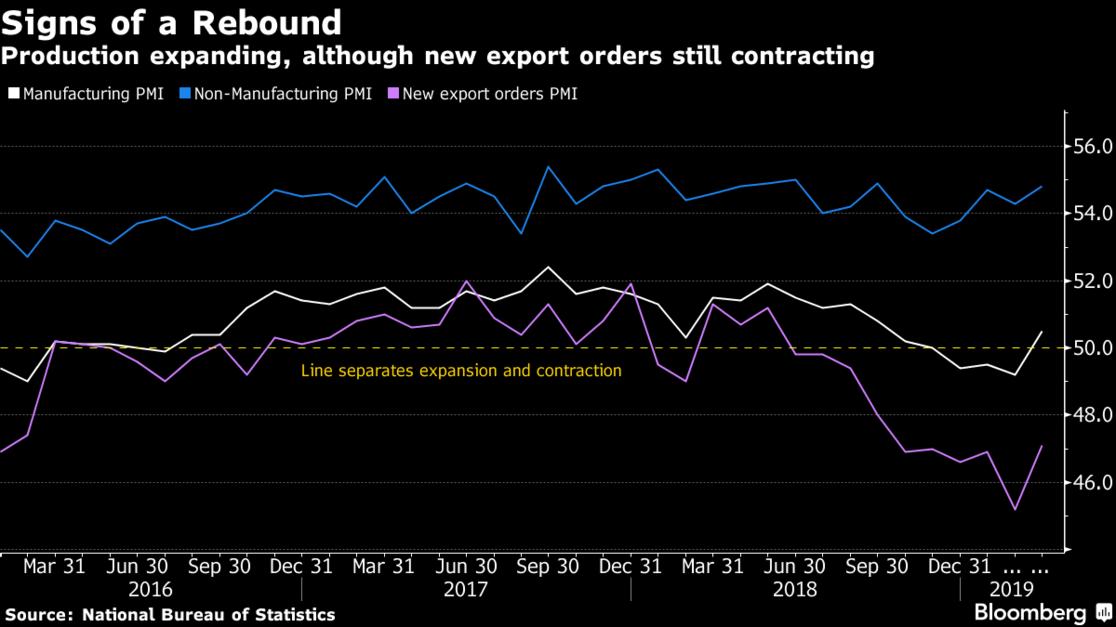
We are seeing slow global economic growth in many regions. The bond market is starting to price in rate cuts, earnings estimates are being revised downward, and I think it is unlikely that the U.S. consumer will be able to pick up the slack given the statistics seen in housing and other credit data.

I expect we will start to see the macro factors come through in 2019 reported earnings. Given the fact that valuations are still elevated, the risk reward on the downside looks far more attractive than on the upside. I have consequently started to short the S&P 500 where the global data points can surprise even more to the downside.

It is certainly possible that the Fed can cut rates or return to quantitative easing with force, to boost the market. But I think we are unlikely to see that until the equity market has had a more significant correction.

https://seekingalpha...-look-appealing


#12 dTraderB

dTraderB

    Member

  • Traders-Talk User
  • 17,455 posts

Posted 30 March 2019 - 03:24 PM

CARL: 


DP WEEKLY/MONTHLY WRAP: Broad Market Divergences
Carl Swenlin |  March 29, 2019 at 06:46 PM


This is a new chart I will be adding to my weekly commentary. My concentration has always been on the S&P 500 Index, but I realized that I needed to broaden my scope somewhat to include other segments of the the broad market, and this is my first effort. The idea is to get a quick scan to see if something needs a closer look. First, we notice that these indexes can be in agreement, as they were last fall. The S&P 500 made a December top beneath the November top, and the other indexes did the same. More recently the S&P 500 made a March top higher than the February top, but the only index to agree was the NASDAQ Composite, which was propelled by the NASDAQ 100 stocks. The others have negative divergences.

1553893864896425174942.png

Some may wonder why I chose the S&P 600 Small-Cap Index instead of the Russell 2000. The reason is simple. The two indexes are quite similar, but StockCharts.com has a complete set of market indicator charts for the S&P 600 that are based upon the components of the S&P 600: A-D Line, A-D Volume Line, Swenlin Trading Oscillator for Breadth and Volume, ITBM and ITVM, Stocks Above 20/50/200EMAs, New Highs and New Lows, and more. You can find this specialized set of indicators in the DecisionPoint Straight Shots ChartPack, as illustrated below. Note that we have several market indexes with collections of their own market indicator charts.


https://stockcharts....ivergences.html


#13 dTraderB

dTraderB

    Member

  • Traders-Talk User
  • 17,455 posts

Posted 30 March 2019 - 03:28 PM

Many are talking about this FRED chart,  

@NorthmanTrader
FollowFollow @NorthmanTrader
More

Federal government current tax receipts YoY Grey areas recessions

D2cOEMpWkAAx1lE.jpg
10:35 AM - 24 Mar 2019


https://northmantrad...3/29/two-faced/


#14 dTraderB

dTraderB

    Member

  • Traders-Talk User
  • 17,455 posts

Posted 30 March 2019 - 03:31 PM

Oh Larry, you will scare the market! 


White House’s Kudlow calls for Fed to ‘immediately’ make half-point cut — and then walks it back a bit

The White House ramps up the political pressure on the Fed.


#15 dTraderB

dTraderB

    Member

  • Traders-Talk User
  • 17,455 posts

Posted 31 March 2019 - 07:39 AM

This is still TOO confusing !   What exactly is he trying to say?


@OddStats
FollowFollow @OddStats
More

The S&P 500 $SPX just put together 3 straight green months to open a year and you want to know how April has done in the past when this has happened. The pattern is obvious - if you can't spot it immediately, you should close your trading account.

D27aH78VYAAghl7.png
11:57 AM - 30 Mar 2019


#16 dTraderB

dTraderB

    Member

  • Traders-Talk User
  • 17,455 posts

Posted 31 March 2019 - 07:41 AM

Larry K all over the media since last week; just saw him on WSJ Editorial report saying a weak China is not a big problem for the US economy. For many of us, the real PROBLEM is WHY is LARRY suddenly out to campaign for a RATE CUT? Is it just to remind the FED to keep things dovish as long as possible or is there a MAJOR PROBLEM ?


@Schuldensuehner

FollowFollow @Schuldensuehner
More

#China’s leading indicator for March signaled a stabilization in the world’s 2nd largest economy, easing one of the biggest worries for the global outlook. Manu purchasing managers index rose to 50.5 from 49.2 last month, the biggest increase since 2012. https://www.bloomberg.com/news/articles/2019-03-31/china-s-factory-rebound-heralds-improvement-in-global-outlook 

D2_BPD1W0AIgM9Z.jpg
4:46 AM - 31 Mar 2019

Edited by dTraderB, 31 March 2019 - 07:43 AM.


#17 AChartist

AChartist

    Tim

  • Traders-Talk User
  • 5,800 posts

Posted 31 March 2019 - 09:57 AM

The 35 week cycle high in a few or more weeks and other low cycles follow likely fall low I will sell some stocks funds along the way and probably some large cap stock to gold funds in a couple weeks, because various global economy failures small cap US stocks probably better than multinationals for the year. The 35 week cycle could be sell in May and go away, mid cycle low 4 months after the high

"marxism-lennonism-communism always fails and never worked, because I know

some of them, and they don't work"  M.Jordan


#18 dTraderB

dTraderB

    Member

  • Traders-Talk User
  • 17,455 posts

Posted 31 March 2019 - 12:45 PM

I have been getting this for a while but not looked at it, until now:

MFU?

SPX 3040?

@seeitmarket
FollowFollow @seeitmarket
More
8:24 PM - 30 Mar 2019


#19 dTraderB

dTraderB

    Member

  • Traders-Talk User
  • 17,455 posts

Posted 01 April 2019 - 05:27 AM

Overnight liftoff but backtracking a bit


Am an early bird this morning trying to catch a few worms


So far, one NQ short


NQ long trades will be full-position 8-lots


Looking for VXXB LONGS with 28 handles


#20 dTraderB

dTraderB

    Member

  • Traders-Talk User
  • 17,455 posts

Posted 01 April 2019 - 07:53 AM

Not saying I am a 100% believer in this rally, especially after the SALES data. 


In fact, I am deeply suspicious of any extreme move in the market, up or down, especially when 

such move is not in sync with reality - economic, political etc. 


However, my primary objective is to make profits, as much as possible, trade WITH The markets on a ST basis, no matter how skeptical or suspicious about the market status or condition.


So, I am venting off some of my suspicion by going long VXXB with a half position at 28.55 or lower.  I hope this will be filled later today, will adjust as market moves up or down, 


I want to also buy back 7 (up  to 10) QQQ puts that I closed last week. I intend to build my bulging JUN & SEP QQQ  PUT holding to as big as it was in January 2018, or even more. I am still aabout 90% cash in LT portfolio. Yeah, I may miss the run up to new highs but I am satisfied with my 12.1% gain YTD, and will wait patiently for a better buying level.