This is from Stockcharts.com, and their version of the S&P sector rotation model:
stockcharts
It lists the sectors that should do well from the economic cycle overlaid with the market cycle.
As the cyclical chart shows, the market tries to anticipate the economic cycle in advance. Therefore, we should expect topping of sectors as shown, in advance of the economic conditions.
I think its evident right now that the energy sector has topped (at least the price pattern seems to suggest so). If you look at the cycle chart, the energy sector top appears related to where the market top should be. Whether that's just convenient placement or not, I'm not sure.
But lets take a look at the economic stages and where we may be at the moment:
1. Inverted to flat yield curve.
2. Industrial production declining to flat.
3. Consumer expectations falling to flat.
For the purpose of this exercise (ie assuming that what S&P provides is true), it would seem to me that we are somewhere between late stages of "early recovery" to late stages of "full recovery".
If we look at the various ETFs that stockcharts.com provides as representative of the various sectors, then after the topping of energy, we should expect the topping of consumer staples (XLP) and health care (XLV).
The last two sectors that should peak are utilities (XLU) and financials (XLF).
There are exceptions to this model, ofcourse. A severe correction often brings down all sectors, regardless of this rotation model. One only has to look at 1936, 1946, 1966, etc. to see that when a severe correction hit, nothing.. even precious metal stocks, was safe from falling.
But assuming an orderly market cycle is present, and that under the assumption energy sector has peaked, the next piece of evidence for someone who is following this S&P model would be the topping of consumer staples (XLP, or equivalent).
Stockcharts.com's use of these S&P sectors maybe a bit misleading, and it might make more sense to use other ETFs to gauge the sector rotation model.. SMH for techs, OIH for energy.. maybe more representative. Perhaps RTH is better than XLP?
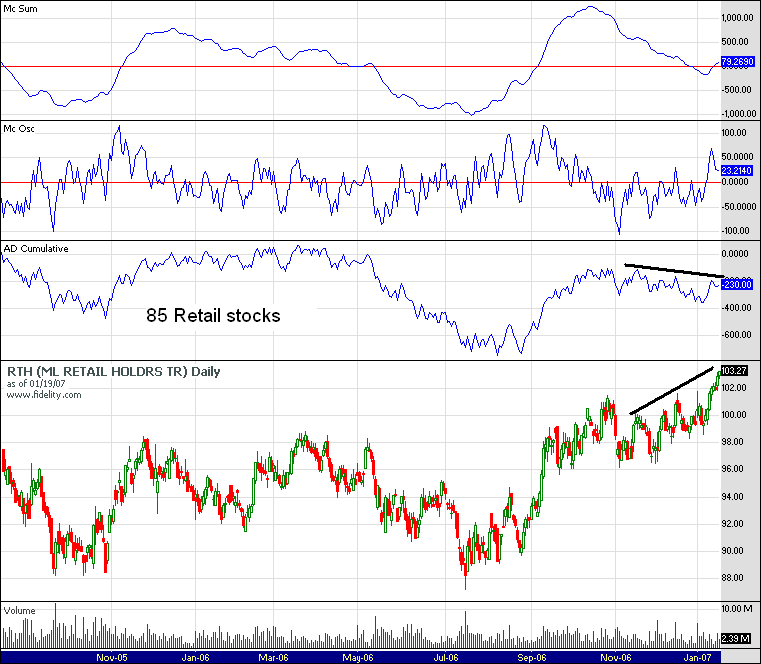
I'll post a cumulative A-D of the retail sector later... but looking at RTH A-D cumulative of the 18 stocks that represents RTH shows this recent rise is being done with less participation than before.

S&P sector rotation model
Started by
dcengr
, Jan 20 2007 01:25 PM
2 replies to this topic
#1

dcengr
-
- Traders-Talk User
- 13,391 posts
Member
Posted 20 January 2007 - 01:25 PM
Qui custodiet ipsos custodes?
#2
dcengr
-
- Traders-Talk User
- 13,391 posts
Member
Posted 20 January 2007 - 02:41 PM
This is RTH overlaid with cumulative A-D from 85 retail stocks..
Seems retail isn't doing as well as price would indicate. The A-D cum is also representative of RTH components (of which there are only 18), ie its diverging with price.
Seems retail isn't doing as well as price would indicate. The A-D cum is also representative of RTH components (of which there are only 18), ie its diverging with price.
Qui custodiet ipsos custodes?
#3
snorkels4
-

- Traders-Talk User
- 2,677 posts
bad guy
Posted 20 January 2007 - 03:25 PM
the divergence is in the dichotomy or 2 headed snake
Rich America, Poor America
By Michael Santoli
Word Count: 1,579
TWENTY-FIVE APARTMENTS IN MANHATTAN sold for more than $20 million in 2005, up from five in 2004, with a few fetching $40 million-plus. NetJets couldn't meet the enormous demand for its private-jet flights over the Thanksgiving holiday. Imports of French cognac into China surged 24% in 2006. And, last May, an unidentified Russian bought Dora Maar with Cat for $95 million, the second-highest price ever for a Picasso.
Never in history have the haves had so much. Burgeoning wealth and incomes from globalizing industries, swelling asset markets, media ubiquity and fast-developing emerging economies are accruing disproportionately to the entrepreneur class ...
THE FULL BARRON'S ARTICLE IS ONLY AVAILABLE TO SUBSCRIBERS.My Webpage
from lee whee
------------------------
also, mish has some of his best fundi analysis yet with his M prime and he proves with charts that consumer sentiment is a lagger. of course all of this means zilch as the trend is still up:
until 200 ma broken? 50-200 ma cross? of course it can be like xds decline with no momentum divergences like has happened in the past. i dont know at this time it seems that even a mini Krashette will be bought with a vengence as their is no risk (cpc still historically high and vix historically low). foreign reserves looking for a place. all of the debt is bullish until it isnt.
hows that for some amateurish mumbo jumbo. this stuff is complicated
Rich America, Poor America
By Michael Santoli
Word Count: 1,579
TWENTY-FIVE APARTMENTS IN MANHATTAN sold for more than $20 million in 2005, up from five in 2004, with a few fetching $40 million-plus. NetJets couldn't meet the enormous demand for its private-jet flights over the Thanksgiving holiday. Imports of French cognac into China surged 24% in 2006. And, last May, an unidentified Russian bought Dora Maar with Cat for $95 million, the second-highest price ever for a Picasso.
Never in history have the haves had so much. Burgeoning wealth and incomes from globalizing industries, swelling asset markets, media ubiquity and fast-developing emerging economies are accruing disproportionately to the entrepreneur class ...
THE FULL BARRON'S ARTICLE IS ONLY AVAILABLE TO SUBSCRIBERS.My Webpage
from lee whee
------------------------
also, mish has some of his best fundi analysis yet with his M prime and he proves with charts that consumer sentiment is a lagger. of course all of this means zilch as the trend is still up:
until 200 ma broken? 50-200 ma cross? of course it can be like xds decline with no momentum divergences like has happened in the past. i dont know at this time it seems that even a mini Krashette will be bought with a vengence as their is no risk
(cpc still historically high and vix historically low). foreign reserves looking for a place. all of the debt is bullish until it isnt. hows that for some amateurish mumbo jumbo. this stuff is complicated
Edited by snorkels4, 20 January 2007 - 03:34 PM.
Andy House, Texas Man, Accidentally Drives 2006 Bugatti Veyron Into Salt Marsh
http://www.zimbio.co...Veyron Crashing
http://www.zimbio.co...Veyron Crashing


