
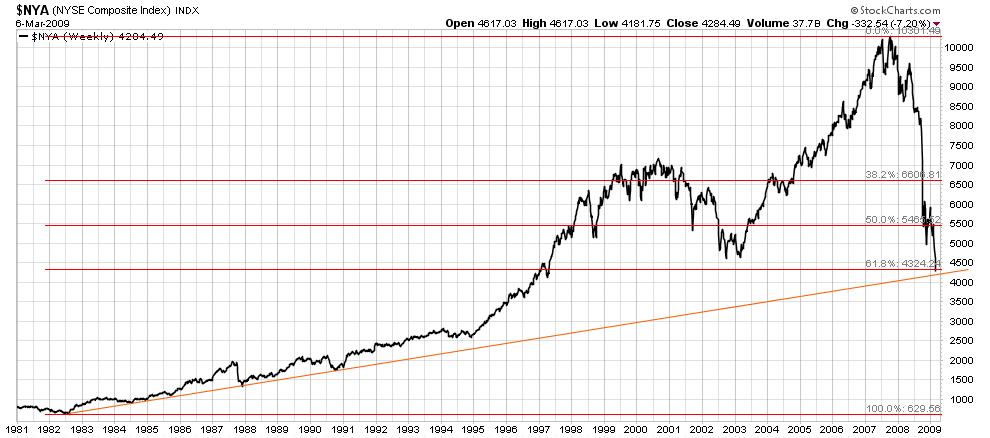
NYA 27 year trendline AND Fib support
Started by
Echo
, Mar 08 2009 03:47 PM
12 replies to this topic
#1

Echo
-
- Traders-Talk User
- 2,273 posts
Member
Posted 08 March 2009 - 03:47 PM
If you liked the 27 year trendline support for the big board, you might be interested in the 61.8% retrace off the 1982 lows for the same index.
Echo
#2
humble1
-

- Traders-Talk User
- 5,959 posts
Member
Posted 08 March 2009 - 04:11 PM
echo:
you are right! it is an exact hit on the spx, too:
1576-105 = 1471
1471 X .618 = 909
1576 - 909 = 667
nicely done!
#3
da_cheif
-

- Traders-Talk User
- 11,019 posts
Member
Posted 08 March 2009 - 07:27 PM
61.8.s dont usually mean much.......unless this time its different.....its the 75 or 70.7 that has more meaning....even more meanigfull in my mind....is the 78.6 off the 1994 low....twas a 4 year cycle.....the nya nailed it along with that trendline off the 82 low
Edited by da_cheif, 08 March 2009 - 07:31 PM.
#4
qqqqtrdr
-

- Traders-Talk User
- 3,247 posts
Member
Posted 08 March 2009 - 07:30 PM
61.8.s dont usually mean much.......unless this time its different.....its the 75 or 70.7 that has more meaning
61,8 is the a strong FIB number......... It increases the likely hood of a bounce. Over the last 4 weeks, we have a greater chance of a bounce here than anytime else...... Are you going to trade it.......
Barry
#5
da_cheif
-
- Traders-Talk User
- 11,019 posts
Member
Posted 08 March 2009 - 07:33 PM
61.8.s dont usually mean much.......unless this time its different.....its the 75 or 70.7 that has more meaning
61,8 is the a strong FIB number......... It increases the likely hood of a bounce. Over the last 4 weeks, we have a greater chance of a bounce here than anytime else...... Are you going to trade it.......
Barry
i got long friday at 675...btw the nya nailed the 78.6 off the 94 low
Edited by da_cheif, 08 March 2009 - 07:34 PM.
#6
da_cheif
-
- Traders-Talk User
- 11,019 posts
Member
Posted 02 August 2009 - 07:01 PM
If you liked the 27 year trendline support for the big board, you might be interested in the 61.8% retrace off the 1982 lows for the same index.
Echo
nice chart eh....

#7
TheArchitect
-

- TT Member+
- 1,659 posts
Member
Posted 02 August 2009 - 07:26 PM
If you liked the 27 year trendline support for the big board, you might be interested in the 61.8% retrace off the 1982 lows for the same index.
Echo
do you regularly use arithmetic scales for such long term charts?
#8
da_cheif
-
- Traders-Talk User
- 11,019 posts
Member
Posted 02 August 2009 - 08:00 PM
If you liked the 27 year trendline support for the big board, you might be interested in the 61.8% retrace off the 1982 lows for the same index.
Echo
do you regularly use arithmetic scales for such long term charts?
echo posted that chart
but arithmatic or log......it all comes out the same.......watch the sky......

#9
Echo
-
- Traders-Talk User
- 2,273 posts
Member
Posted 12 September 2009 - 11:08 PM
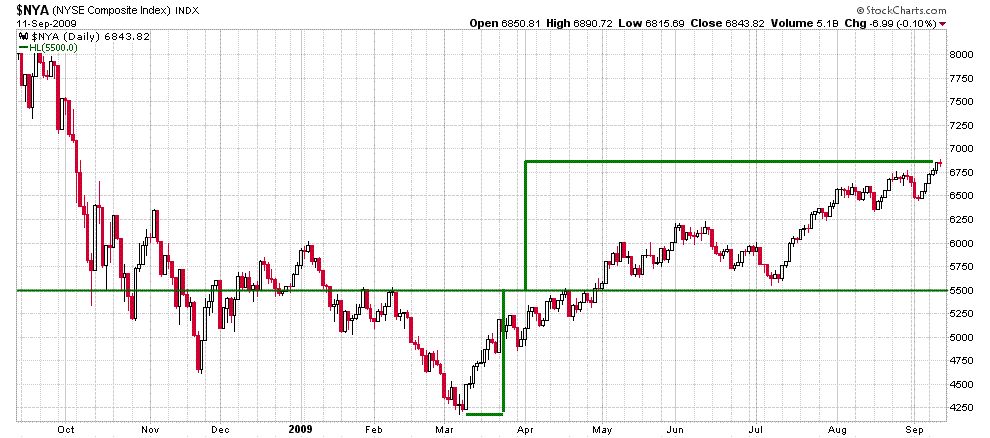
The first target on the NYA is met. Could see a reaction down from it.
Echo
Attached Thumbnails
#10
spielchekr
-

- Traders-Talk User
- 3,104 posts
Member
Posted 13 September 2009 - 10:15 AM
Here's a Fib fan for your study's period and scaling.


