Jump to content


Photo

Why This Rally's Going to be Pretty Big...IMVHO


  • Please log in to reply
9 replies to this topic

#1 inamosa

inamosa

    Patterns-based Trader and Investor in ETFs and Futures

  • Traders-Talk User
  • 1,638 posts

Posted 04 April 2009 - 11:04 PM

Chart 1: Breaking Out Across the Board
Posted Image

Notice:
-$VIX is about to break down from a descending triangle ($ONE:$VIX is about to break out and up from an ascending triangle) - the roof will come off if the $VIX breaks down from this (everyone will be going nuts).
-$SOX is about to break out of an ascending triangle and has already broken out of initial resistance. No lower low = double bottom in the Semis.
-$SPX about to break out of a bullish channel (the FTSE has already done so).
-The 13 and 34 EMAs, which are special and have a good history of reliability, have just crossed for the first time in several months.


Chart 2: Consumerism Returning, Risk Aversion Declining
Posted Image

Notice:
-(Discretionaries:Staples) or (XLY:XLP) is breaking above a multi-year trendline. This points to a change in the appetite of consumers and investors to spend / take on more risk.
-Breaking out of an ascending triangle.
-Closing above the 200-day SMA for the first time in a very long time.


Chart 3: No Such Thing as a Triple Top
Posted Image

Notice:
-No such thing as a triple top - about to make a higher high. Semis have already made a higher low and are about to make a higher high. These two facts are bullish.
-Double bottom and absence of a lower low.
-The risk-loving Nasdaq and Semis are leading this rally in the markets, which means it could go on for quite a while.


---

Very quickly, a couple more:

US Dollar Index H&S Formation - I Believe About to Break Down
Posted Image

-Cradle resistance being formed will prevent $USD Index from moving higher for now
-Head and shoulders breakdown points to $79-80 as next stop for $USD Index


FTSE Breakout from Bullish Wedge
Posted Image

--

All of this is FWIW with the usual caveats (i.e. opinion subject to change...blah blah blah) and in my IMVHO

Edited by alysomji, 04 April 2009 - 11:07 PM.

"Our job is not to predict where the market will go, but to interpret daily price and volume action to ascertain the facts of the current environment and make decisions based on that interpretation."
-Scott O'Neil (son of William O'Neil), Portfolio Manager at O誰eil Data Systems, when asked where the Dow would go in the coming months

#2 inamosa

inamosa

    Patterns-based Trader and Investor in ETFs and Futures

  • Traders-Talk User
  • 1,638 posts

Posted 04 April 2009 - 11:18 PM

I want to add that the amount of divergence we have in indicators like MACD (5,34,5) is reminiscent of the 2002 bottom, so this should be good for a strong rally. I don't believe we've bottomed. In the 2000-02 bear, we tested the 200-day SMA four times. On the fourth test, we got over it. Normally, a bear market will have at least 1 or 2 of these tests. So far, we've tested the 200-day SMA two times and I'm anticipating our third one will come in the next few months. 200-day SMA currently sits near $SPX 1000.
"Our job is not to predict where the market will go, but to interpret daily price and volume action to ascertain the facts of the current environment and make decisions based on that interpretation."
-Scott O'Neil (son of William O'Neil), Portfolio Manager at O誰eil Data Systems, when asked where the Dow would go in the coming months

#3 tomterrific14

tomterrific14

    Member

  • Traders-Talk User
  • 1,451 posts

Posted 05 April 2009 - 08:50 AM

I want to add that the amount of divergence we have in indicators like MACD (5,34,5) is reminiscent of the 2002 bottom, so this should be good for a strong rally. I don't believe we've bottomed.

In the 2000-02 bear, we tested the 200-day SMA four times. On the fourth test, we got over it.

Normally, a bear market will have at least 1 or 2 of these tests. So far, we've tested the 200-day SMA two times and I'm anticipating our third one will come in the next few months.

200-day SMA currently sits near $SPX 1000.


I prefer to use the 200 day MA or the 39 week MA , currently at 983 and declining at the rate of 13 points per week, so in 4 weeks it would be at approx. 930.....It will continue to decline for the next 12 weeks as long as tthe SPX is below 1100. And since the bear market began in earnest, there has not been a test of the 200 day MA.....perhaps it is about to test the declining 200 day MA in the next month at around the 930-940 level....an ideal sell spot, especially if the Transports do not confirm by bettering their Jan highs.

#4 blackprince

blackprince

    Member

  • Traders-Talk User
  • 209 posts

Posted 05 April 2009 - 10:21 AM

alysomji the charts warmed the cockles of my bullish heart. Thanks ever so.

#5 inamosa

inamosa

    Patterns-based Trader and Investor in ETFs and Futures

  • Traders-Talk User
  • 1,638 posts

Posted 05 April 2009 - 10:26 AM

Hi Tom, Thanks for sharing that re: 39-week SMA. I'll take a look at a chart like that. The tests of the 200-day SMA I was referring to so far in this bear market is firstly in December 2007 and then again in May 2008. Since then we haven't had a test. I would agree a new test would be an idea sell spot - especially because I don't think 666 was a bottom.
"Our job is not to predict where the market will go, but to interpret daily price and volume action to ascertain the facts of the current environment and make decisions based on that interpretation."
-Scott O'Neil (son of William O'Neil), Portfolio Manager at O誰eil Data Systems, when asked where the Dow would go in the coming months

#6 inamosa

inamosa

    Patterns-based Trader and Investor in ETFs and Futures

  • Traders-Talk User
  • 1,638 posts

Posted 05 April 2009 - 10:32 AM

200-day SMA currently sits near $SPX 1000.


I should've noted, as Tom kindly pointed out, that the 200-day SMA is of course falling somewhat rapidly each day. Not sure where it will be the next time it gets tested, but perhaps in the low to mid-900s.
"Our job is not to predict where the market will go, but to interpret daily price and volume action to ascertain the facts of the current environment and make decisions based on that interpretation."
-Scott O'Neil (son of William O'Neil), Portfolio Manager at O誰eil Data Systems, when asked where the Dow would go in the coming months

#7 TheArchitect

TheArchitect

    Member

  • TT Member+
  • 1,659 posts

Posted 05 April 2009 - 10:38 AM

Chart 3: No Such Thing as a Triple Top


Notice:
-No such thing as a triple top - about to make a higher high. Semis have already made a higher low and are about to make a higher high. These two facts are bullish.
-Double bottom and absence of a lower low.
-The risk-loving Nasdaq and Semis are leading this rally in the markets, which means it could go on for quite a while.


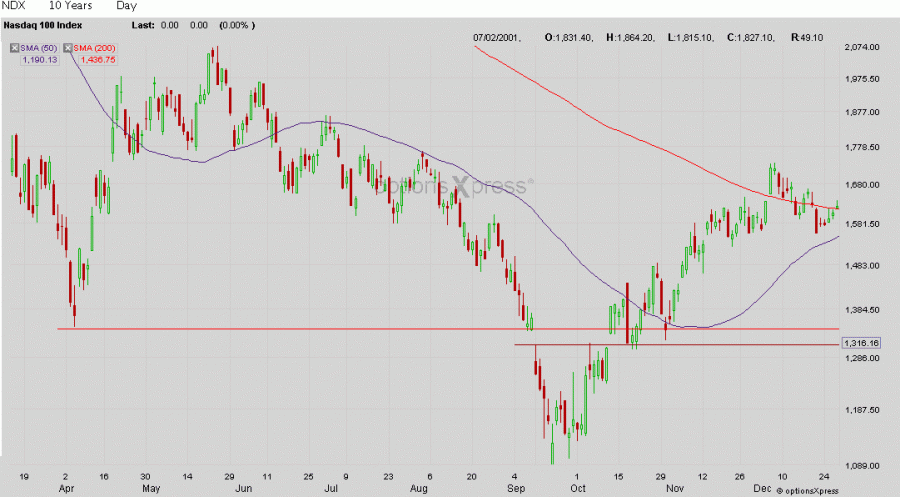
The more speculative stocks leading this rally was expected as seen in the Naz's relative strentgh... the thing that may stop this cold is, the gap region formed by the 2001 false island bottom, between about 1310 - 1330. Notice... we're in the lower boundary of that now . :)

naz2001gap.gif

#8 nimblebear

nimblebear

    Welcome to the Dark Side !

  • Traders-Talk User
  • 6,062 posts

Posted 05 April 2009 - 10:39 AM

the dola chart is most crucial. it breaks lower an d this pig flys. nasduck also. its gonna fly too. leading this market higher. wall of worry is huge. the spx looks shortable as hel*.
OTIS.

#9 inamosa

inamosa

    Patterns-based Trader and Investor in ETFs and Futures

  • Traders-Talk User
  • 1,638 posts

Posted 05 April 2009 - 10:48 AM

the dola chart is most crucial. it breaks lower an d this pig flys. nasduck also. its gonna fly too. leading this market higher. wall of worry is huge. the spx looks shortable as hel*.


Yes, the whole bullish case rests on the idea that these securities will break out as expected. Any failure will make a serious dent in the bullish case.

Keep an eye on this chart, as well, since we may have a breakout in the NYSE New Highs Lows Ratio:
Posted Image

This is a chart I made recently. It's not super useful or anything but watch for a breakout at the very right (i.e. current price and sloping resistance line).

Happy to share things with this board, where I've learned so much. I'm still a young trader with a lot of inexperience and have learned much from many posters here (even you, nimblebear :) ).
"Our job is not to predict where the market will go, but to interpret daily price and volume action to ascertain the facts of the current environment and make decisions based on that interpretation."
-Scott O'Neil (son of William O'Neil), Portfolio Manager at O誰eil Data Systems, when asked where the Dow would go in the coming months

#10 borland

borland

    Member

  • Traders-Talk User
  • 276 posts

Posted 05 April 2009 - 12:05 PM

alysomji,

That congestion area in your chart is the Zweig Breadth Thrust Indicator which possibly could signal a LT 'buy' soon.

I will wait for confirmation, but seems like everyone's watching the same charts as yours, and calling a bear market bottom ... Tom Bowley posting on StockCharts.com Blog and here... skip to last video (Part 3) .... Bull Market Already Started!