
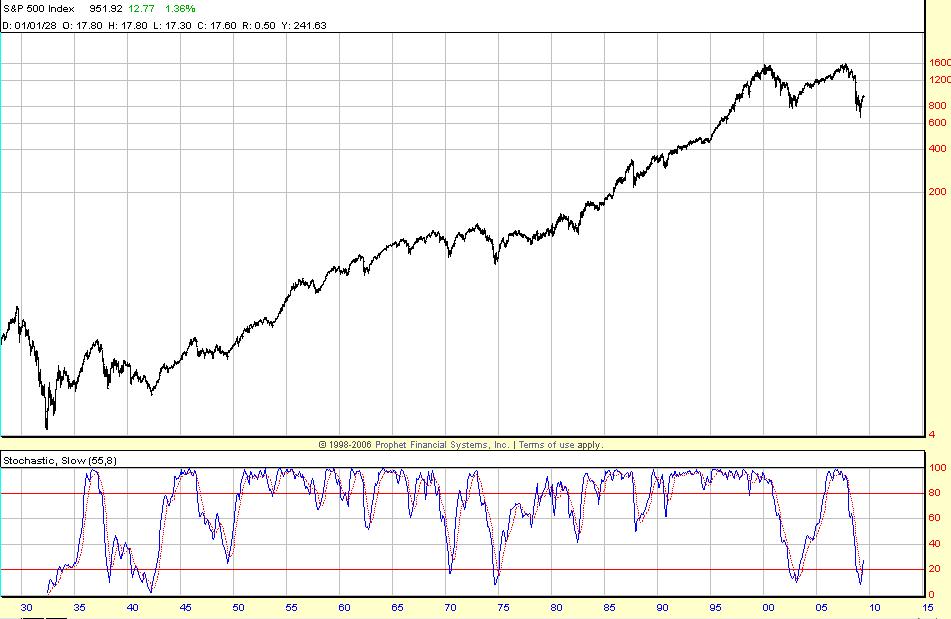
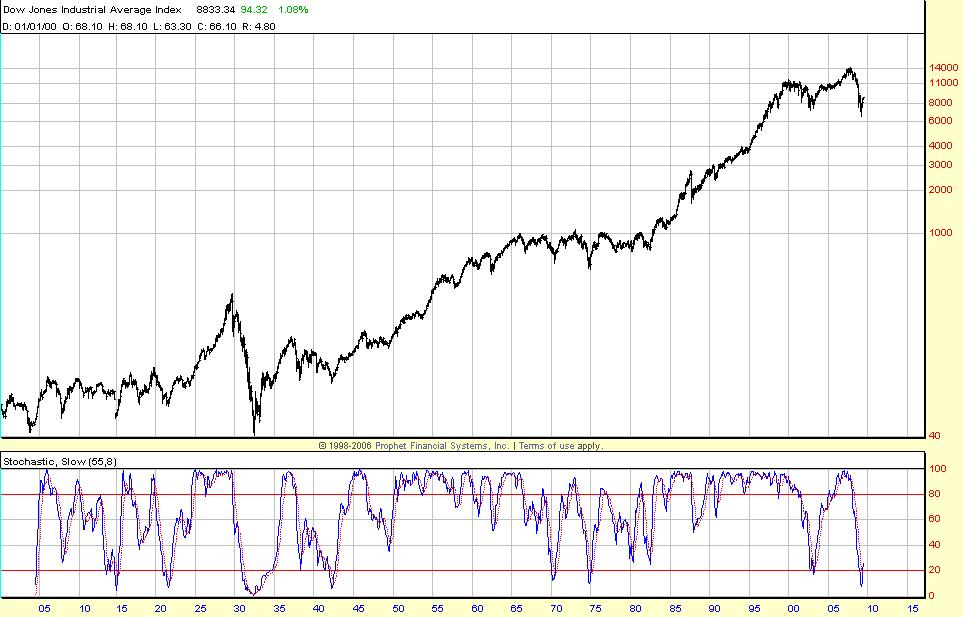
I only find convincing context in very long-term charts. Recent periods are only comparable to several times in the last century. In the past 100 years, when the STO moves up from deep below 20, it proceeds to 80 without a significant set-back. It also usually does so surprisingly quick. It has has a long way to go ..... as also evidenced by other LT charts posted earlier here.
http://www.traders-t...howtopic=106496


