Last time it did, it was a fakeout. If this breakout stays above major Down T/L, bears should think hard, maybe stop kicking the spurs and even drop the Inverse ETFs play, looking for uptrend development plays instead. This breakout is huge consider how long this downtrend had been in force. So will the bull trap be huge, if it fail. Behavior in last four weeks was very different than that of the last fakeout/breakout though. Hugging under the T/L but refused to go down was a stealth strength until it finally broke to the upside.
Of course, more upside moves here will mean the "Jump the Creek", "Maginot Line" and "Second Mouse Got the Cheeze" all get to playout in my SPX chart next.
.

XLF Breakout
Started by
iloli way
, Jul 19 2009 06:27 AM
14 replies to this topic
#1

iloli way
-
- TT Member*
-

- 4,028 posts
iloli = I'm Laws Of Line's I(eye)
Posted 19 July 2009 - 06:27 AM
PRICE IS KING; LINE RULES! - Laws Of Line (LOL) Trading Systems
Swing Those Lines: I can calculate the motion of heavenly bodies, but not the madness of people! -- Issac Newton
Swing Those Lines: I can calculate the motion of heavenly bodies, but not the madness of people! -- Issac Newton
#2
kssmibotm
-

- Traders-Talk User
- 654 posts
Member
Posted 19 July 2009 - 09:31 AM
...bears should think hard, maybe stop kicking the spurs and even drop the Inverse ETFs play, looking for uptrend development plays instead..
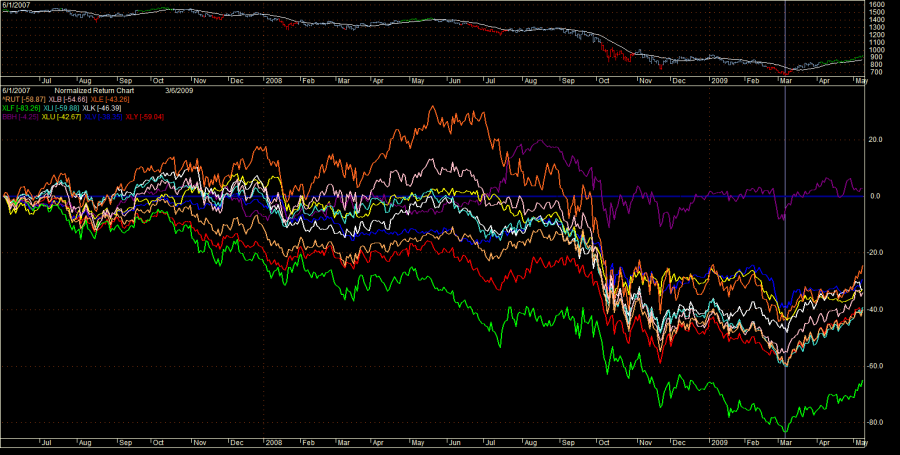
In my March 1 post, I indicated that all asset bubbles eventually lose 80% or more from the peak. The XLF met that threshold on March 6 with an 83% decline from the May 2007 peak as shown in the chart below (see green line). The surge in XLF relative strength out of that low supports the idea that the painful work required to deflate the financial bubble was successfully completed. I agree that "looking for uptrend development plays" is the right thing to do.
KMB
http://www.traders-t...?...&hl=Bubbles

People think the Holy Grail is something looked for but never found. In fact, it is something often found but rarely recognized.

#4
MoneyFriend
-

- Traders-Talk User
- 917 posts
Member
Posted 19 July 2009 - 12:00 PM
A few high volume days above 12.50 and the new range likely becomes 13 to 17.50

#5
jjc
-

- Traders-Talk User
- 2,886 posts
Member
Posted 19 July 2009 - 01:14 PM
A few high volume days above 12.50 and the new range likely becomes 13 to 17.50
IMVHO; The majority of trades tend to be in the individual bank names (and other proxy trading vehicles), therefore I would be less trusting of a volume analysis on the ETF. I believe the
banks as a group are destine to trade in a much higher price range so I would not take issue with your conclusion.
Good to see you posting again MF.
Edited by jjc, 19 July 2009 - 01:15 PM.
#6
Cirrus
-

- TT Patron+
- 5,735 posts
Member
Posted 19 July 2009 - 02:01 PM
I tell you what would get a LOT of the smarter traders and market pundits:
The SPX rallies enought over the next several weeks to flip the 50wkma's up (and 13 month for that matter). It then proceeds to correct abruptly down to flip the nicely negative.....and then begins the new cyclical bull market. Tell me that wouldn't be the ultimate money grab...
#7
MoneyFriend
-
- Traders-Talk User
- 917 posts
Member
Posted 19 July 2009 - 04:09 PM
A few high volume days above 12.50 and the new range likely becomes 13 to 17.50
IMVHO; The majority of trades tend to be in the individual bank names (and other proxy trading vehicles), therefore I would be less trusting of a volume analysis on the ETF. I believe the
banks as a group are destine to trade in a much higher price range so I would not take issue with your conclusion.
Good to see you posting again MF.
It's not a volume distribution it's TPO. A volume histogram of XLF would be misleading, as the volume picked up exponentially as the price decreased.
#8
jjc
-
- Traders-Talk User
- 2,886 posts
Member
Posted 19 July 2009 - 06:25 PM
A few high volume days above 12.50 and the new range likely becomes 13 to 17.50
IMVHO; The majority of trades tend to be in the individual bank names (and other proxy trading vehicles), therefore I would be less trusting of a volume analysis on the ETF. I believe the
banks as a group are destine to trade in a much higher price range so I would not take issue with your conclusion.
Good to see you posting again MF.
It's not a volume distribution it's TPO. A volume histogram of XLF would be misleading, as the volume picked up exponentially as the price decreased.
I did not recognize it as a TPO distribution.
I learn something new everytime you post.
#9
iloli way
-
- TT Member*
-
- 4,028 posts
iloli = I'm Laws Of Line's I(eye)
Posted 19 July 2009 - 06:41 PM
KMB,...bears should think hard, maybe stop kicking the spurs and even drop the Inverse ETFs play, looking for uptrend development plays instead..
In my March 1 post, I indicated that all asset bubbles eventually lose 80% or more from the peak. The XLF met that threshold on March 6 with an 83% decline from the May 2007 peak as shown in the chart below (see green line). The surge in XLF relative strength out of that low supports the idea that the painful work required to deflate the financial bubble was successfully completed. I agree that "looking for uptrend development plays" is the right thing to do.
KMB
http://www.traders-t...?...&hl=Bubbles
Yep, that was a great call, considering almost all (including this board) at the time still complacently thumbing noses to fed and new treasury kid in town. I posted in your March 1 thread as:
QUOTE To summarize, watch the XLF relative strength for signs of a bottom. As for forecasting when the low will occur or what price the low will be... KMB
I agree. Even though some call this sector is turning into utility like, I still think there is something VERY BIG going under the radar, as to WHY this whole world wide bubble pricked by couple of revitalized rules during 2007, doing the real great wealth being change hands. So banks are going to rise as Phoenix through fire by those hands changed....
In fact, I started my first of series buy of FAS in the $3 range in March breakout of the ORANGE T/L in my chart of XLF. Financial bubble burst is eye catching yet fearful for trader to profit from; but it offered one of the most rewarding trade besides the milenium tech bubble trade.
PRICE IS KING; LINE RULES! - Laws Of Line (LOL) Trading Systems
Swing Those Lines: I can calculate the motion of heavenly bodies, but not the madness of people! -- Issac Newton
Swing Those Lines: I can calculate the motion of heavenly bodies, but not the madness of people! -- Issac Newton
#10
colion
-

- Traders-Talk User
- 1,169 posts
Member
Posted 19 July 2009 - 06:47 PM
Last time it did, it was a fakeout. If this breakout stays above major Down T/L, bears should think hard, maybe stop kicking the spurs and even drop the Inverse ETFs play, looking for uptrend development plays instead. This breakout is huge consider how long this downtrend had been in force. So will the bull trap be huge, if it fail. Behavior in last four weeks was very different than that of the last fakeout/breakout though. Hugging under the T/L but refused to go down was a stealth strength until it finally broke to the upside.
Of course, more upside moves here will mean the "Jump the Creek", "Maginot Line" and "Second Mouse Got the Cheeze" all get to playout in my SPX chart next.
On log scale, no need to jump the creek as the trendline is up around 16.


