
I've seen over a dozen charts indicating a cyclical bull has started in the past couple of weeks
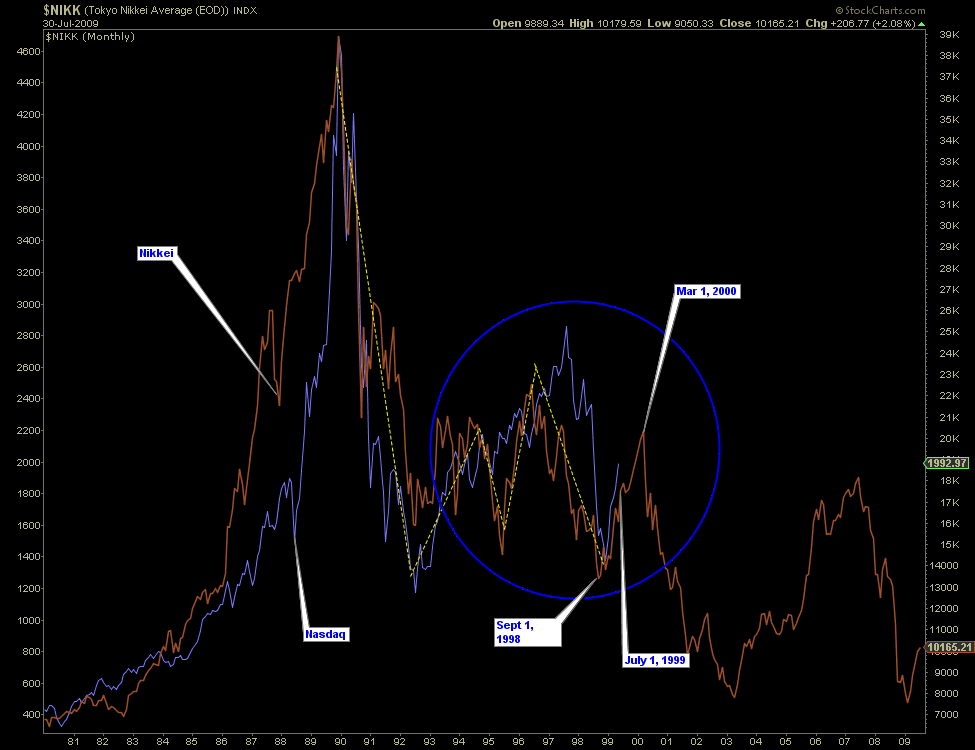
If we aren't, then we should see, IMHO, a multi-year blowoff top between 1050 and 1100 (similar to 1938 scenario) before the end of the year (probably between Sept and Dec, ideally November)...the likelihood of this happening is low given historical probabilities...on the other hand, I wouldn't dismiss it given the strange economic times America is in
I have basically been flat since July 23rd when my short got stopped out (breakout past 957 cash occurred on this day): http://www.traders-t...?...st&p=472404
(other than ST / multi-day bearish positions...I currently have one now as I shorted the S&P at yesterday's close)
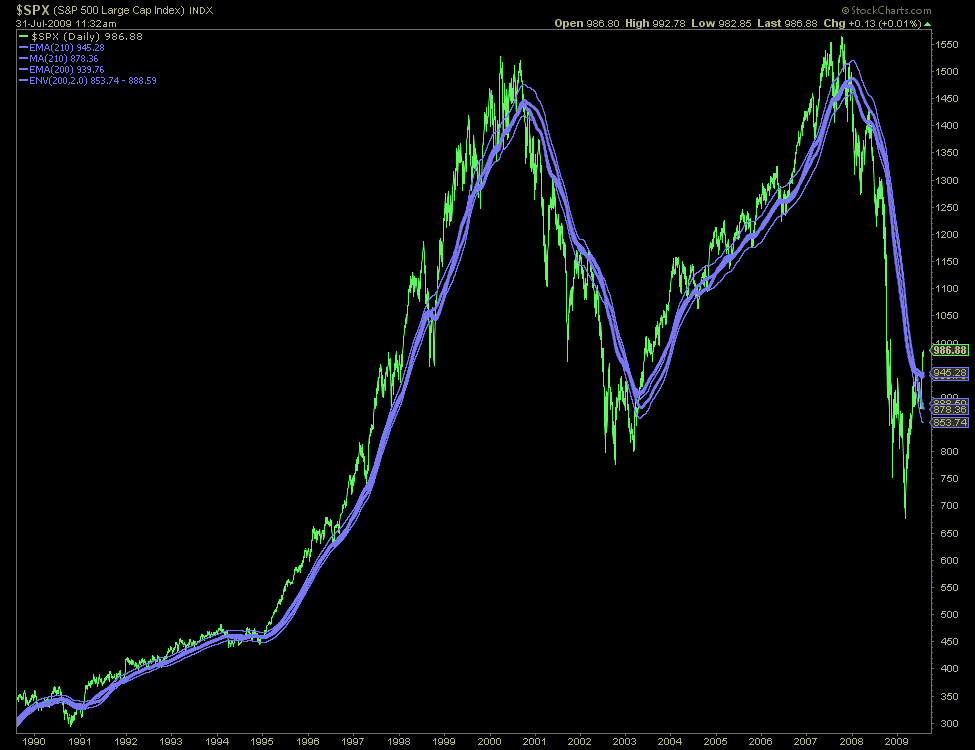
If we corrected to 940-950 on the cash S&P from here, I would consider going long if we successfully tested there (basically the breakout point), as that would indicate at least some type of rally continuation
A bearish conviction bar sending us below 940 on the cash would indicate a multi-week to multi-month top is in...which certainly doesn't mean the cyclical bull is over but just that there is more correcting to do, likely a test of the 900 level is in the cards, for instance, minimally
Time wise, early August, with a move not much past beyond here (maybe near 1020, if we get past 1000) would be fitting for a multi-week to multi-month top and Sept/Oct would be fitting for the next (higher) bottom to come in, if this is indeed a cyclical bull and not a blowoff-type bear market rally a la 1938 (which would instead project to a top at 1050-1100 of the blowoff variety, coming between Sept and December, ideally November)
Just my point of view right now, FWIW
By the way, 956 intraday high to 869 intraday low = 9% correction...in case anyone missed that
And, I have no idea when the cyclical bull would end if we are in one (probabilities say we are, at this point), but one projection I have is late 2010 to early 2011
Attached Thumbnails
Edited by alysomji, 31 July 2009 - 10:44 AM.


