Jump to content


Photo

This Wall Will Take at Least a Bit of Time to Get Through


  • Please log in to reply
3 replies to this topic

#1 inamosa

inamosa

    Patterns-based Trader and Investor in ETFs and Futures

  • Traders-Talk User
  • 1,638 posts

Posted 15 August 2009 - 01:10 AM

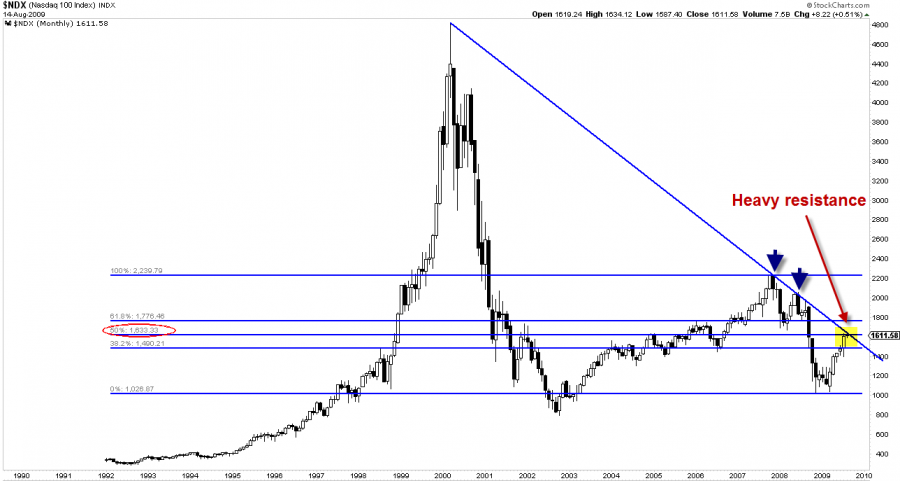
Some backing and filling at a minimum is required and that is what we're starting to see, to get the momentum to get through this wall That is, if this market is still destined to go higher I'm inclined to think yes but it doesn't really matter right now - bottom line is the trend is up and internals are rolling but not quite enough yet to cause a multi-week trend change (close, but no cigar, maybe next week)

Attached Thumbnails

  • 8_15_2009___NDX_Monthly.png

Edited by alysomji, 15 August 2009 - 01:12 AM.

"Our job is not to predict where the market will go, but to interpret daily price and volume action to ascertain the facts of the current environment and make decisions based on that interpretation."
-Scott O'Neil (son of William O'Neil), Portfolio Manager at O’Neil Data Systems, when asked where the Dow would go in the coming months

#2 punter

punter

    Member

  • Traders-Talk User
  • 1,899 posts

Posted 15 August 2009 - 01:24 AM

Would you have any look ahead indicators or statistics describing probability of breakouts over such resistance?

Keep Calm and be Long

My opinion on markets, or anything, is a health hazard. Follow or fade at your own risk!


#3 inamosa

inamosa

    Patterns-based Trader and Investor in ETFs and Futures

  • Traders-Talk User
  • 1,638 posts

Posted 15 August 2009 - 01:50 AM

Based on the fact that the S&P and Dow have not yet retraced even 50% of their decline from late 2007 to March of this year (only at 38% so far), and that the typical post-crash retracement is 62% and in rare cases 50% (notice Nasdaq above is at 50%), and the fact that the Dow has a high-probability head-and-shoulders pattern on its weekly chart indicating a measured move to close to 11,400 (or 10,680 if you factor in likelihood of reaching measured move), etc. Well, you can see, it's likely to me we break through that trendline, even before factoring in all the internal indications of a bull market I've come across, all suggesting that there should be more to this cyclical bull market than just what we've already seen (also keep in mind cyclical bulls typically last a minimum of one year). However, it's possible the Nasdaq could also decouple from the Dow and S&P, to allow the Dow and S&P to reach their 50-62% retracements, while Nasdaq starts drifting lower. I see this as a pretty low probability scenario, however. At this time, regardless of the seemingly odds above of breaking through the trendline, one must be open-minded and also keep in mind that if the trend line is going to be broken, it may take some longer than anticipated tossing and turning. Nothing goes straight up. This could be the first real impediment for this rally. To me, NDX has led this rally and will likely also lead the end of it, so it should be watched very closely.

Edited by alysomji, 15 August 2009 - 01:52 AM.

"Our job is not to predict where the market will go, but to interpret daily price and volume action to ascertain the facts of the current environment and make decisions based on that interpretation."
-Scott O'Neil (son of William O'Neil), Portfolio Manager at O’Neil Data Systems, when asked where the Dow would go in the coming months

#4 punter

punter

    Member

  • Traders-Talk User
  • 1,899 posts

Posted 15 August 2009 - 02:14 AM

Thanks for the comprehensive reply. I am not as thorough in my analysis before making the trade. I typically just wait for a breakout or a clean rejection before entering a trade. My observation thus far is that a breakout at this point typically lead to a run of decent size. This would fit your analysis of a run for 61.8%.

Thanks again and good luck.


Based on the fact that the S&P and Dow have not yet retraced even 50% of their decline from late 2007 to March of this year (only at 38% so far), and that the typical post-crash retracement is 62% and in rare cases 50% (notice Nasdaq above is at 50%), and the fact that the Dow has a high-probability head-and-shoulders pattern on its weekly chart indicating a measured move to close to 11,400 (or 10,680 if you factor in likelihood of reaching measured move), etc.

Well, you can see, it's likely to me we break through that trendline, even before factoring in all the internal indications of a bull market I've come across, all suggesting that there should be more to this cyclical bull market than just what we've already seen (also keep in mind cyclical bulls typically last a minimum of one year). However, it's possible the Nasdaq could also decouple from the Dow and S&P, to allow the Dow and S&P to reach their 50-62% retracements, while Nasdaq starts drifting lower. I see this as a pretty low probability scenario, however.

At this time, regardless of the seemingly odds above of breaking through the trendline, one must be open-minded and also keep in mind that if the trend line is going to be broken, it may take some longer than anticipated tossing and turning. Nothing goes straight up. This could be the first real impediment for this rally.

To me, NDX has led this rally and will likely also lead the end of it, so it should be watched very closely.


Keep Calm and be Long

My opinion on markets, or anything, is a health hazard. Follow or fade at your own risk!