He ( Michael Belkin) claims the number 200 for the monthly and weekly MAs has worked to define levels of support and resistance in every major bubble and crash he has studied over the last 100 years. A bear-market bounce in a stock index or commodity from its 200-month average to its 200-week average, he says, is relentless, takes about a year and ends with low volatility -- all characteristic of the recent U.S. rally. I want to verify this conclusion in my 200-year chart because, if true, many new investment tools will become available for the future.
His success with these long term moving averages suggest I should follow suit with a new study which will be published here over the next few months. I already have the Dow Industrial or equivalent data back for two centuries, so his 200 months moving average conclusions arent a problem. The 200 week Moving Average can be approximated in terms of months so I can research his concept and perhaps find another set of tools to refine this big picture.
The main area of interest is to check his contention that a post bubble decline will bottom at a 200 month MA, then peak at a higher 200 week Moving Average. Keep in mind we are not talking about a commonly watched 200-Day moving average. These are very long term trend criteria that could prove interesting because no one is watching them. The critical conclusion however will be whether the historical record of post bubble recovery peaks has in fact peaked at the 200 week MA. If so we are nearing a potentially important peak.
I can check these criteria through this long history very easily and will post the results in a week or two.
Terry Laundry
March 10, 2004 in Equity Mega-Ts
http://bigcharts.mar...&mocktick=1.png

Michael Belkin's moving average theory from Terry Laundry
Started by
Russ
, Aug 23 2009 06:02 PM
6 replies to this topic
#1

Russ
-
- Traders-Talk User
- 7,375 posts
Member
Posted 23 August 2009 - 06:02 PM
"Nulla tenaci invia est via" - Latin for "For the tenacious, no road is impossible".
"In order to master the markets, you must first master yourself" ... JP Morgan
"Most people lose money because they cannot admit they are wrong"... Martin Armstrong
http://marketvisions.blogspot.com/
"In order to master the markets, you must first master yourself" ... JP Morgan
"Most people lose money because they cannot admit they are wrong"... Martin Armstrong
http://marketvisions.blogspot.com/
#2
inamosa
-

- Traders-Talk User
- 1,638 posts
Patterns-based Trader and Investor in ETFs and Futures
Posted 23 August 2009 - 06:30 PM
Thanks
Looking forward to what you have to say
Personally, I don't attach any significance to moving averages (just my opinion)
"Our job is not to predict where the market will go, but to interpret daily price and volume action to ascertain the facts of the current environment and make decisions based on that interpretation."
-Scott O'Neil (son of William O'Neil), Portfolio Manager at ONeil Data Systems, when asked where the Dow would go in the coming months
-Scott O'Neil (son of William O'Neil), Portfolio Manager at ONeil Data Systems, when asked where the Dow would go in the coming months
#3
Russ
-
- Traders-Talk User
- 7,375 posts
Member
Posted 23 August 2009 - 06:46 PM
Thanks
Looking forward to what you have to say
Personally, I don't attach any significance to moving averages (just my opinion)
In this case that moving average forecast is based on looking back at 100 years of data, so I think it is worth paying attention to, it also agrees with some of my work and Terry Laundry's work.
"Nulla tenaci invia est via" - Latin for "For the tenacious, no road is impossible".
"In order to master the markets, you must first master yourself" ... JP Morgan
"Most people lose money because they cannot admit they are wrong"... Martin Armstrong
http://marketvisions.blogspot.com/
"In order to master the markets, you must first master yourself" ... JP Morgan
"Most people lose money because they cannot admit they are wrong"... Martin Armstrong
http://marketvisions.blogspot.com/
#4
inamosa
-
- Traders-Talk User
- 1,638 posts
Patterns-based Trader and Investor in ETFs and Futures
Posted 23 August 2009 - 07:02 PM
bear trap-bull trap-bear trap
http://www.traders-t...?...110073&st=0
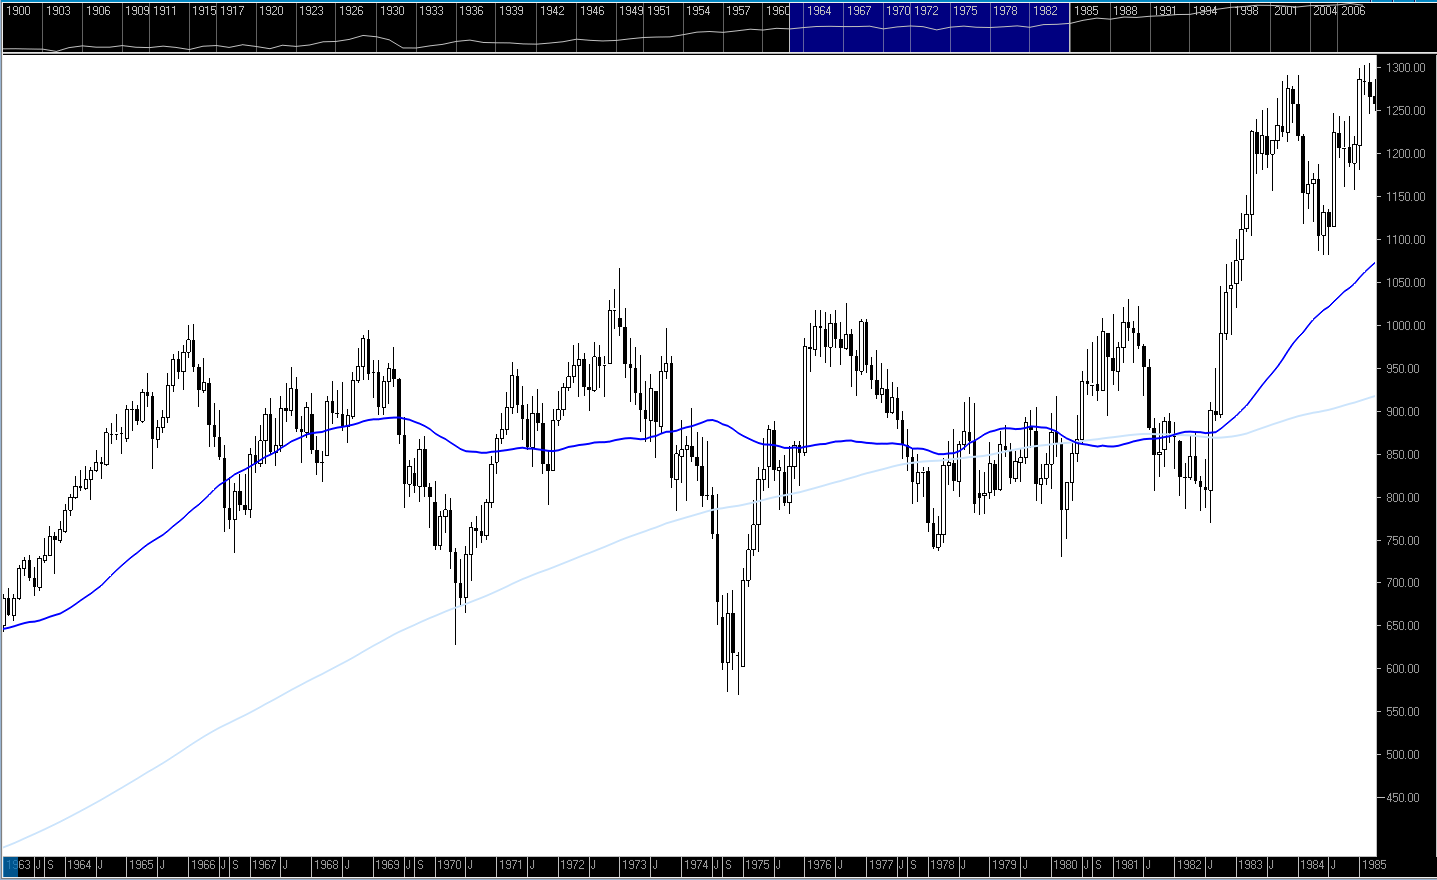
I have Dow data going back to 1900 and am plotting these MAs as we speak and don't see anything particularly significant
Below is the 66-82 for example
Attached Thumbnails
"Our job is not to predict where the market will go, but to interpret daily price and volume action to ascertain the facts of the current environment and make decisions based on that interpretation."
-Scott O'Neil (son of William O'Neil), Portfolio Manager at ONeil Data Systems, when asked where the Dow would go in the coming months
-Scott O'Neil (son of William O'Neil), Portfolio Manager at ONeil Data Systems, when asked where the Dow would go in the coming months
#5
inamosa
-
- Traders-Talk User
- 1,638 posts
Patterns-based Trader and Investor in ETFs and Futures
Posted 23 August 2009 - 07:13 PM
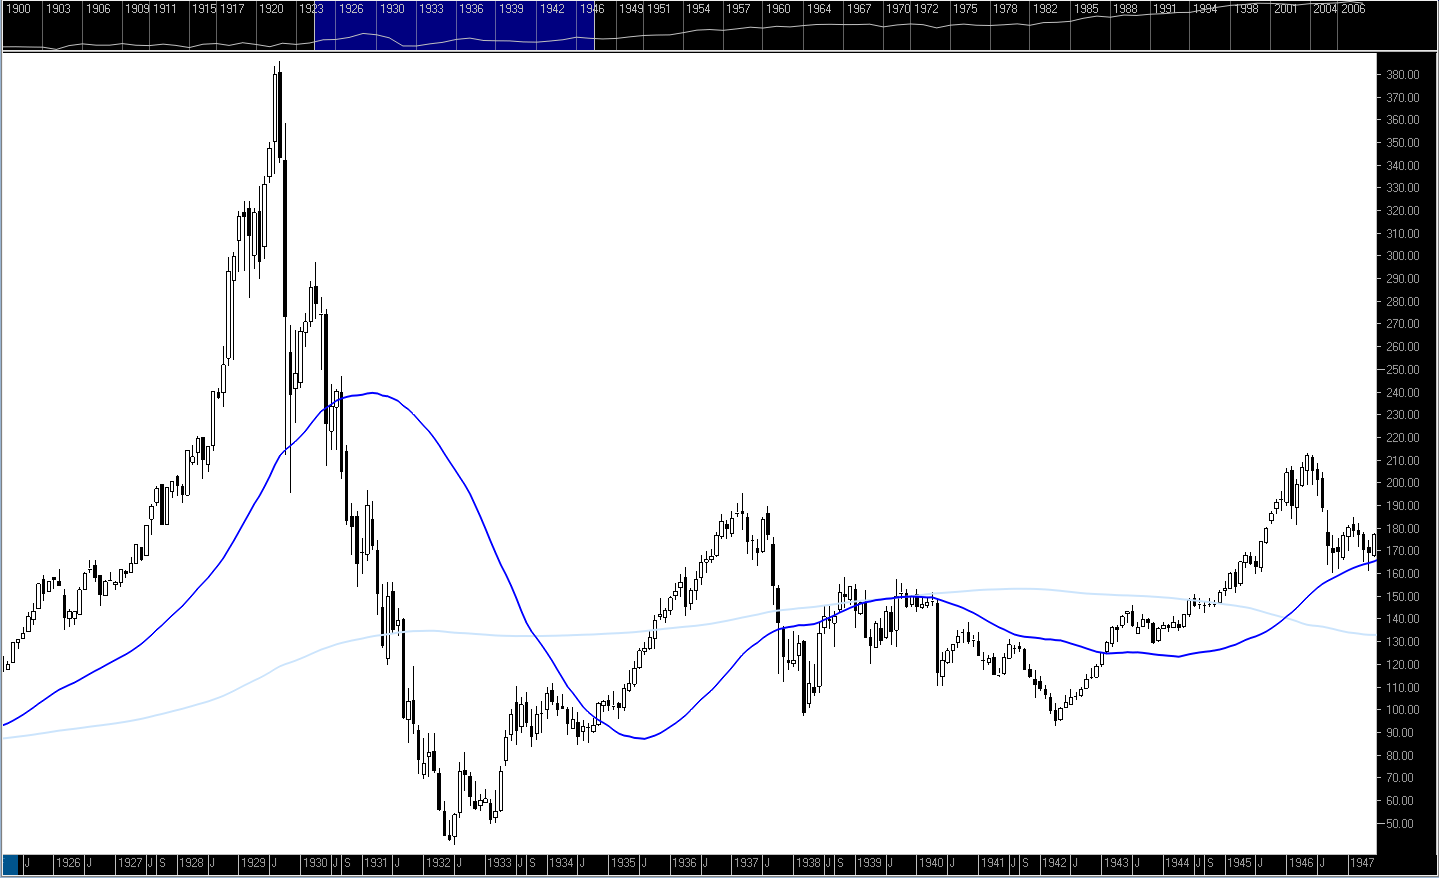
1929:
Attached Thumbnails
"Our job is not to predict where the market will go, but to interpret daily price and volume action to ascertain the facts of the current environment and make decisions based on that interpretation."
-Scott O'Neil (son of William O'Neil), Portfolio Manager at ONeil Data Systems, when asked where the Dow would go in the coming months
-Scott O'Neil (son of William O'Neil), Portfolio Manager at ONeil Data Systems, when asked where the Dow would go in the coming months
#6
Russ
-
- Traders-Talk User
- 7,375 posts
Member
Posted 23 August 2009 - 08:02 PM
The chart I posted shows that after the 2002-2003 low the market rallied up to the 200 week moving average in 2004.
Your chart shows that after the 1974 low the market rallied up to your dark blue average, which I assume is the 200 week ma, the same thing can be seen on my chart.
"Nulla tenaci invia est via" - Latin for "For the tenacious, no road is impossible".
"In order to master the markets, you must first master yourself" ... JP Morgan
"Most people lose money because they cannot admit they are wrong"... Martin Armstrong
http://marketvisions.blogspot.com/
"In order to master the markets, you must first master yourself" ... JP Morgan
"Most people lose money because they cannot admit they are wrong"... Martin Armstrong
http://marketvisions.blogspot.com/
#7
inamosa
-
- Traders-Talk User
- 1,638 posts
Patterns-based Trader and Investor in ETFs and Futures
Posted 23 August 2009 - 08:22 PM
IMHO, above, all you're seeing is a retracement to a fib level - as opposed to a rally to a particular MA
Yes, dark blue line = 200-week MA
"Our job is not to predict where the market will go, but to interpret daily price and volume action to ascertain the facts of the current environment and make decisions based on that interpretation."
-Scott O'Neil (son of William O'Neil), Portfolio Manager at ONeil Data Systems, when asked where the Dow would go in the coming months
-Scott O'Neil (son of William O'Neil), Portfolio Manager at ONeil Data Systems, when asked where the Dow would go in the coming months


