The first clue that we had a possible bottom on our hands came on June 10th.
On the 8th we had a BEARISH cloud cover and on the 9th a sharp move UP. Kind of a candle failure.
Followed the next day by another long grey candle.
But the real clue was the bullish divergnce between NDX and CompQ. It seems like NDX is always the most "agressive of the two, always turning before compq, and here NDX had 3 higher lows while compQ had three lower lows and SPX something in between. Also the massive bearish talk with crash mentioned in the majority of posts (including my astro post) made me later suspicious.
And then last Tuesday on the 8th we broke the double bottom in SPX.
As well as in the NYSE index. It was the 4th time the lower median was tried for a break - and it's usually the 4th time the break occurs. But we broke also the double bottom and 50% retracement resistance, And if we look closely we can se that the correction after the break is not leaning downwards, but up. thats bullish.
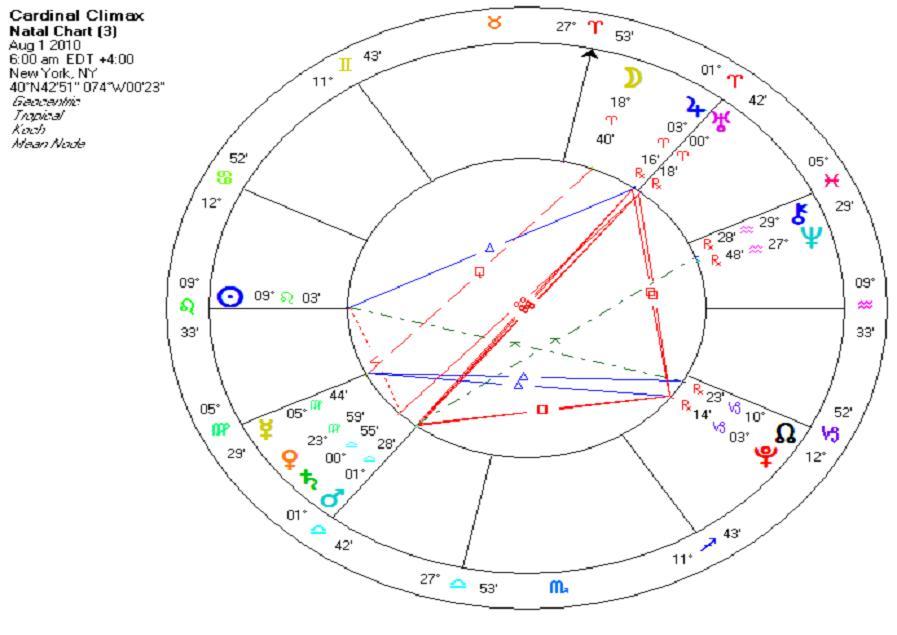
Another confirmation is the Mars trine Calactic Center aspect (120 degrees apart as seen from earth - rembeer Lagrange points in my astro post?)
If you look closely you can see that the aspect has a tendency to occur at tops and bottoms in this 10 year old chart.
The aspect occured on May 31st, which was a holliday in the US, so let's look at june1st.
In this chart I have used a foldback technique which you can use for W and double W bottoms.
If you fold bottom "A" UP" to "B" so you have a W and then fold the middle of the W="B" down to "C" you often se that this date is the "true" bottom, in the sense that you can use it for time studies, like the astro study above.
But let's look at price.
This week on tuesday the 8th, we saw another dramatic move.
Why was it dramatic?
Because we were breaking out and needed energy for that break, which came from the Jupiter Uranus conjunction that day.
So what did we break?
Well, thre differnet Pitchforks one old top and the 200MA1
Not bad.
There are no coincidences in the market, everything happens for a reason - not often obvious to us - and here is a clue the market is sending us.
The sharp move last Tuesday did not only break evything in sight but also the cross between the, perhaps, most importan trendline from the Aug 8 top (blue) and the 200MA on the same day.
Hence one of the most bullish breaks of the year.
And I would say that a long (medium?) term break had occured. especiall since we now have seen two downside failure breaks. something very important must have happend in this last long "energy period" that made the market chnge its mind.
And here my astropost comes to mind. The constellation I was showing was between the outer planets with long cycles. Therefore a trendchange does not have to be precise (Uranus for instance takes 84 years to rotate around the sun).
My assumption was that the aspects would accelerate the decline (happens 15% of the time) but in fact what we have seen is a bottom (85% of the time). I was evidently caught up in the negative energy that preceeded the bottom.
Another very important chart is this one, showing a Head and Shoulder downside failur break.
This break is usually very good to trade on since they generally cause a speedy advances in a short time and they usually test the "Head" and sometimes (often) move above the top.
Hence, we have another signal that twe might be moving above the April 2010 top and continue the bullmarket.
This chart shows the mega fibonacci cluster we also broke through.
But look also at the long term oscillator - first we have a bullish divergence then we have a kiss of life (KOL) and finally there is plenty of room until the oscillator is overbought.
I argued above that the Jupiter Uranus "helped" SPC to break out.
Here is what Merriman states in his astro book on "Stock market timing" from 2001, with regard to aspects that involve Uranus.:
:.. it can coincide with a sudden reversal of direction on the part of a world leader, or an act of great risk by a group that may pose a danger to the lives of others. In financial markets, it can correlate with reversal of trend, or pause, or an explosive breakout of support or resistance. With Uranus, you never know for sure what the event is, or what the reaction will be.
Today we have a Sun square Uranus aspect and in the chart below we can se what happend when we had that aspect in the past 15 years. (70% trendchanges and 30% were break outs) A sudden move today was to be ruled out and taken the other charts in this post into account it was also probable.
This chart is also very important.
We have here a perfect ABC correction that ends at the lower trendline of the blue trendchannel. getting in there again - with a gap - would be very convincing for a bullish case. just like it did this morning, then i maybe not an ABC correction but a 1-2-3-4-5 move, now entering W3 - that would be nice

Dollar and stock indexes were for a while invers correlated.
If they are doing it again this chart with a break of two trendlines that turned out to be a failure is confirming the bullish case.
Especially since the seasonal index in "Unfair Advantage" shows a bottom in the euro.....
Therefore I think it's time to take down my bearish post from may 4th
Perhaps we just have witnessed the correction that fooled the majority ... and me


 time to get back to business for some serious stuff