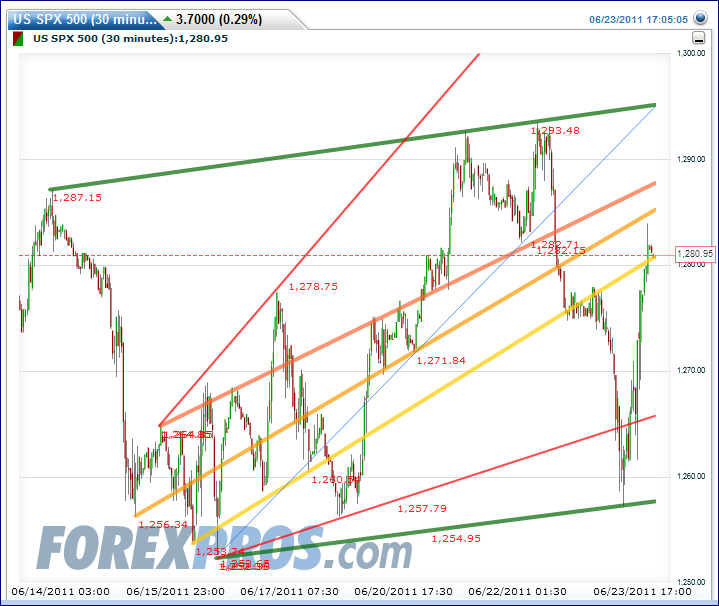
Been a week long test, hump over that double 'green/red' bearish engulfing candle (same as Green Channel in the next 30min chart) will get bulls back in swinging again. I just can't wait til I can finally proclaim: the line rules!
The intraday 30-min chart posted yesterday: Now we need to rise above that Green channel to confirm the low was in.
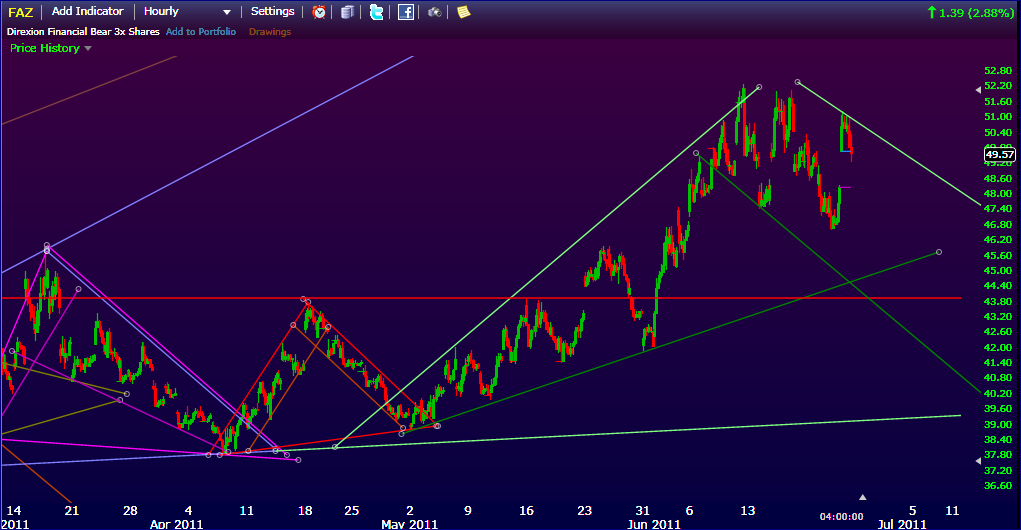
FAZ, a tough bear this time: Well I've been saying financials had bottomed since XLF reached target, but dog gone did not expect this much fight. Yesterday I saw the tendency of price may tag the right shoulder line (tentatively created by paralleled previous triangle's), after FAZ broke the "M" Top baseline (target to Red flat line) and bounced up; but I did not expect it jumped almost 10% from last lows to today's highs (sweating~). Before the final back breaking moves near closing today, it did not go beyond that right shoulder slop line anytime all day but hugging it very closely tho. This is the tell-tale chart for the market as a whole. Unless it breakout and make new highs, this green giant triangle (vs. previous ones) pretty much encapsulated FAZ; but we'll still need to see how ES panning out to confirm that.
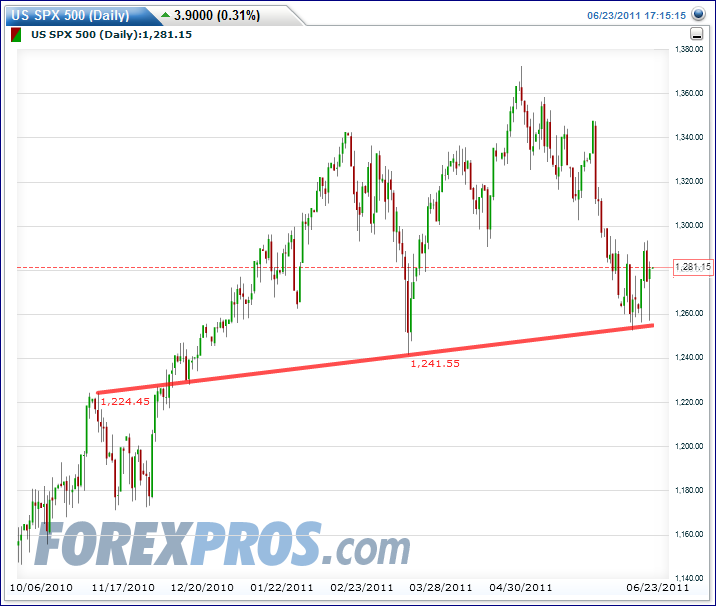
BTW, the last downward Yellow Line of SPX is about 4.5 points above today's close. So, that's another line needed to confirm the bull's back and of my official bias too.
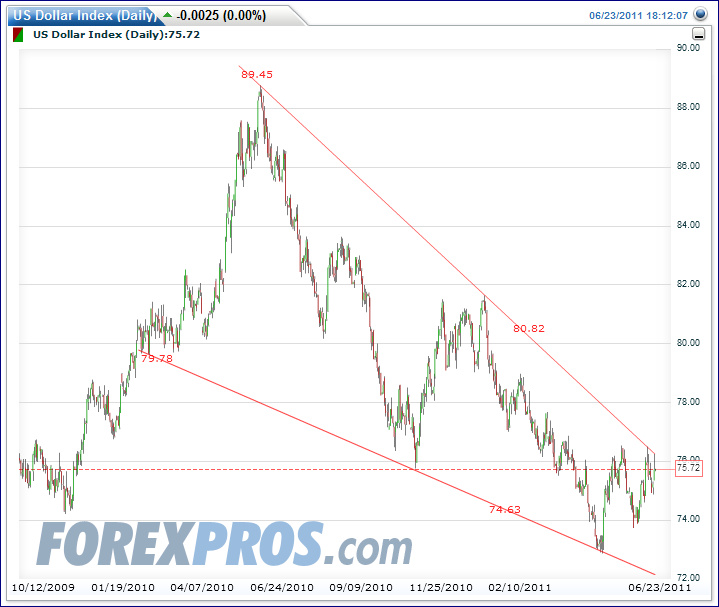
USD like Humpty Dumpty fell off the Wall again, sigh*~, it was quite a sight, did bring some bricks down while tried tearing it down, Mr. Gorb. The line up there is a Great Wall !