On Jan 23rd 2013
HERE , I said BKX will reach 57.26 (38.2 % fibo of 09~07) :
Since BKX already consolidating above the Red Line, BO of Blue Line will bring in 38.2 fibo next.
3/15/13 we breached that the first time since '10. Today is the first revisit of that 38.2% after 3/15, and we had a close above it at 57.68.
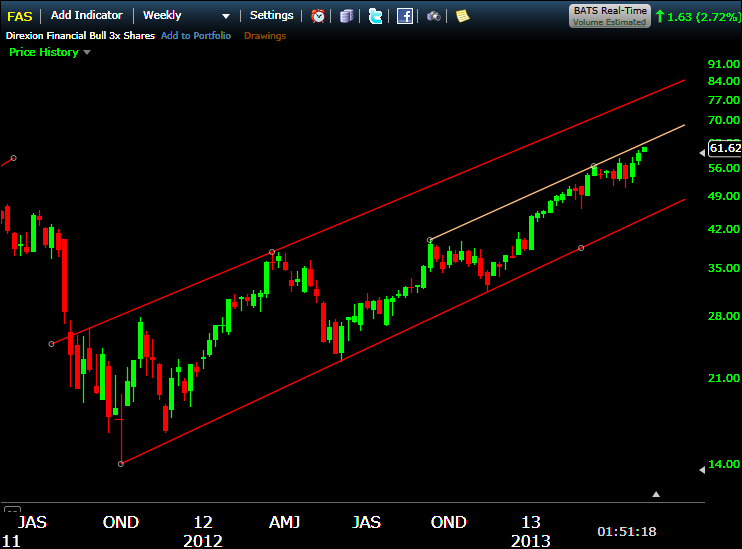
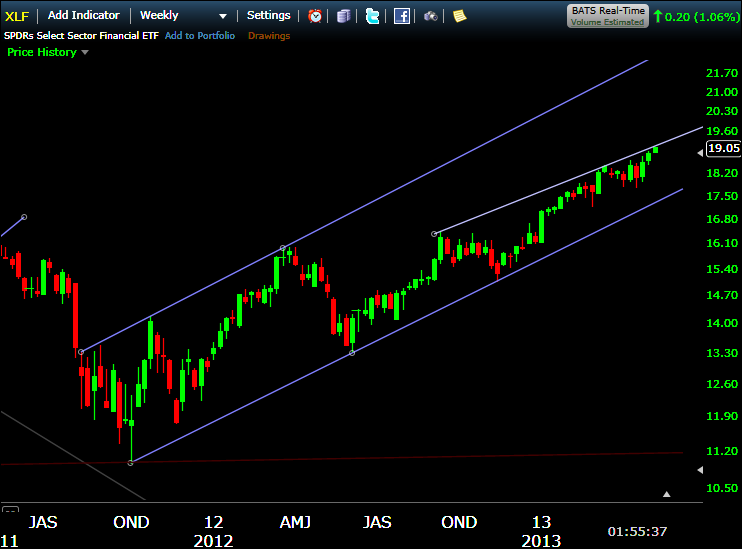
To put this into "too close for comfort" context, lo and behold, BKX agrees with my chart/line analogy for XLF and FAS.
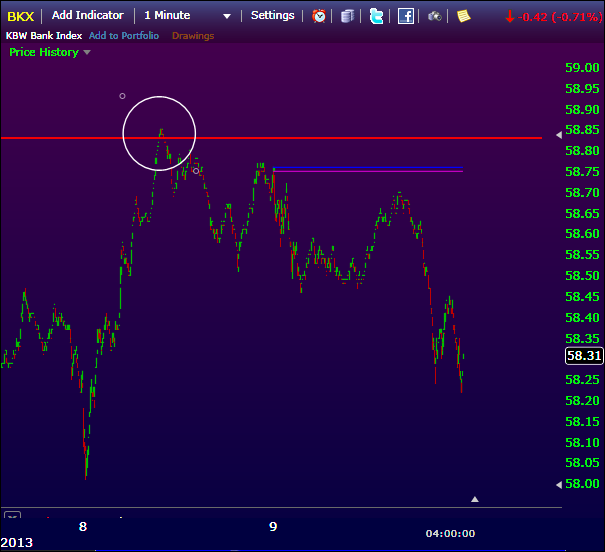
The BKX own version of 'TCFC' is lined at
58.83 - the top Red Line in next chart, the 2010 high.
This next chart depicting the 'major pattern' of BKX - as an Ascending Triangle defined in 2 Red Lines. The 'touch' requirement is 'two on each side of the Red TLs', with distinctive peaks and valleys. With volume trending downward to support the legitimacy (as in laws) of the pattern. With breakout upward 70% of the time. But, the downward performance is 9 out of 21, vs upward's 17 out of 23 (with 1 being the best).

So, we are on the verge of touch/reverse the Red Line above today's closing price; or BO of it? All I can say is watch these lines for "TOO CLOSE FOR COMFORT", fair enough?
i

i
Edited by iloli, 06 May 2013 - 04:08 PM.