http://www.marketwat...rket-2015-08-11

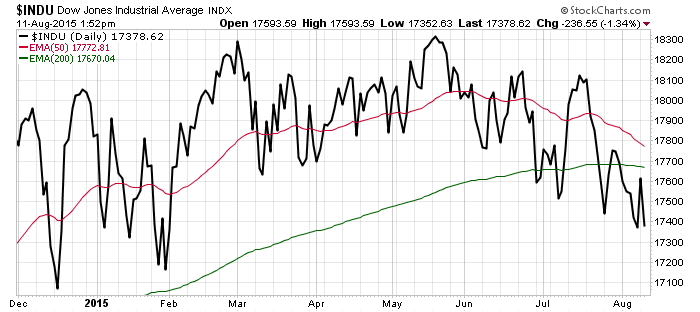
Dow death cross is a bearish omen for the stock market
Started by
Dex
, Aug 11 2015 11:47 AM
21 replies to this topic
#1

Dex
-
- Traders-Talk User
- 2,692 posts
Member
Posted 11 August 2015 - 11:47 AM
"The secret of life is honesty and fair dealing. If you can fake that, you've got it made. "
17_16
17_16
#2
fib_1618
-

- Traders-Talk User
- 10,145 posts
Member
Posted 11 August 2015 - 12:05 PM
That's a "simple" way of looking at it.
Fib
Better to ignore me than abhor me.
“Wise men don't need advice. Fools won't take it” - Benjamin Franklin
"Beware of false knowledge; it is more dangerous than ignorance" - George Bernard Shaw
Demagogue: A leader who makes use of popular prejudices, false claims and promises in order to gain power.
Technical Watch Subscriptions
#3
brucekeller
-

- Traders-Talk User
- 1,140 posts
Member
Posted 11 August 2015 - 12:16 PM
Well if MW posted it, we must be near a bottom... then again, what happens if they start not being a good contrarian indicator??
#4
claire
-

- Traders-Talk User
- 649 posts
Member
Posted 11 August 2015 - 12:17 PM
Fib, what are alternate ways of looking at it?
#5
fib_1618
-
- Traders-Talk User
- 10,145 posts
Member
Posted 11 August 2015 - 12:31 PM
"Exponentially"Fib, what are alternate ways of looking at it?
Fib
Better to ignore me than abhor me.
“Wise men don't need advice. Fools won't take it” - Benjamin Franklin
"Beware of false knowledge; it is more dangerous than ignorance" - George Bernard Shaw
Demagogue: A leader who makes use of popular prejudices, false claims and promises in order to gain power.
Technical Watch Subscriptions
#6
claire
-
- Traders-Talk User
- 649 posts
Member
Posted 11 August 2015 - 12:49 PM
Are you saying there is no death cross when viewed exponentially?
#7
fib_1618
-
- Traders-Talk User
- 10,145 posts
Member
Posted 11 August 2015 - 12:54 PM
Are you saying there is no death cross when viewed exponentially?
Better to ignore me than abhor me.
“Wise men don't need advice. Fools won't take it” - Benjamin Franklin
"Beware of false knowledge; it is more dangerous than ignorance" - George Bernard Shaw
Demagogue: A leader who makes use of popular prejudices, false claims and promises in order to gain power.
Technical Watch Subscriptions
#8
claire
-
- Traders-Talk User
- 649 posts
Member
Posted 11 August 2015 - 01:07 PM
Thanks Fib. Also, I assume that you believe it should be viewed exponentially. I'm not sure I should ask why because the answer will probably be beyond my comprehension. Can you explain it to those who are mathematically compromised?
#9
salam
-

- Traders-Talk User
- 1,579 posts
Member
Posted 11 August 2015 - 01:12 PM
Thanks Fib. Also, I assume that you believe it should be viewed exponentially. I'm not sure I should ask why because the answer will probably be beyond my comprehension. Can you explain it to those who are mathematically compromised?
simple is closing price
Exp is av daily price....I think
I'm not sure what my future holds... But I know who holds it.
#10
MaryAM
-

- Traders-Talk User
- 1,200 posts
Member
Posted 11 August 2015 - 01:16 PM
The DOW is just a horrible indicator because there is no constant in the equation and therefore is not a valid mathematical formula. The divisor is so low now its headed toward infinity which is undefined. 100 points on the DOW is only about a $15 move. At least doing a log function on the DOW would add some validation to trends - but every time a stock is substituted or the divisor is lowered - a new graph is the only thing one can look at from the date of the change forward until the next change - long term trends do not even have the same components much less the same divisor.Thanks Fib. Also, I assume that you believe it should be viewed exponentially. I'm not sure I should ask why because the answer will probably be beyond my comprehension. Can you explain it to those who are mathematically compromised?


