Jump to content


Photo

SPY


  • Please log in to reply
4 replies to this topic

#1 hiker

hiker

    independent trader

  • TT Member*
  • 12,118 posts

Posted 02 January 2009 - 12:45 PM

SPY 92.63 is the horizontal above of interest now to me in measuring risk/reward now at the current hod of 92.13

based on daily SPY charts posted before here since Oct 10

no need to repeat chart link, since NOTHING has changed related to the price horizontals

91.17 needs to hold for daily closes..one idea

Edited by hiker, 02 January 2009 - 12:46 PM.


#2 hiker

hiker

    independent trader

  • TT Member*
  • 12,118 posts

Posted 02 January 2009 - 01:00 PM

similarly 85.88 for GS is the major horizontal above current price that I have been following on the lifetime weekly since the move down none of the price horizontals posted for the GS chart since Oct 10 have changed, so no need to repost the GS chart ----- for XLI, the minimum horizontal that defines XLI breakout is: 24.16 to 26.06 horizontal zone (now above current price)

Edited by hiker, 02 January 2009 - 01:05 PM.


#3 snorkels4

snorkels4

    bad guy

  • Traders-Talk User
  • 2,677 posts

Posted 02 January 2009 - 01:09 PM

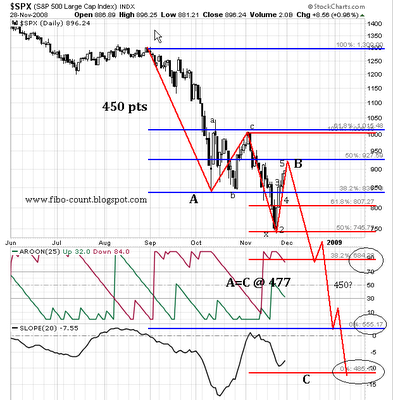
pfwave chart from while back

Posted Image
Andy House, Texas Man, Accidentally Drives 2006 Bugatti Veyron Into Salt Marsh

http://www.zimbio.co...Veyron Crashing

#4 hiker

hiker

    independent trader

  • TT Member*
  • 12,118 posts

Posted 02 January 2009 - 01:34 PM

XHB 12.25 is key price horizontal going back mos. now hod is testing 12.25

#5 hiker

hiker

    independent trader

  • TT Member*
  • 12,118 posts

Posted 02 January 2009 - 04:02 PM

13:59:42 [hiker] 2sweeties RL for the SPX weekly is 94.7% odds to meet resistance at 929.65 14:00:08 [hiker] different R value than on the SPX daily anyone that has been paying attn to my posts this week knows whose website and statistical analysis to which I refer

Edited by hiker, 02 January 2009 - 04:04 PM.