NDX 1295...SPX 950...OEX 454
http://stockcharts.com/c-sc/sc?s=$NDX&p=M&yr=13&mn=6&dy=0&i=p54170002834&a=98654220&r=8954.png
http://stockcharts.com/c-sc/sc?s=$SPX&p=M&yr=20&mn=11&dy=29&i=p24995734351&a=90720826&r=9962.png
http://stockcharts.com/c-sc/sc?s=$OEX&p=M&yr=20&mn=11&dy=30&i=p06408734985&a=155752773&r=3811.png

Same charts...
Started by
eminimee
, Jan 03 2009 11:05 AM
4 replies to this topic
#1

eminimee
-
- TT Member
- 14,307 posts
I don't care who's fur is flying...
Posted 03 January 2009 - 11:05 AM
#2
kssmibotm
-

- Traders-Talk User
- 654 posts
Member
Posted 03 January 2009 - 11:47 AM
TP,
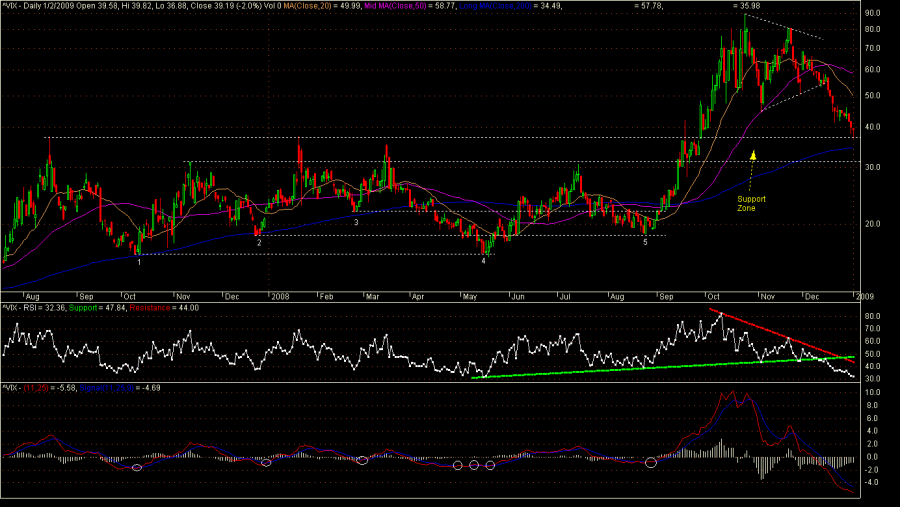
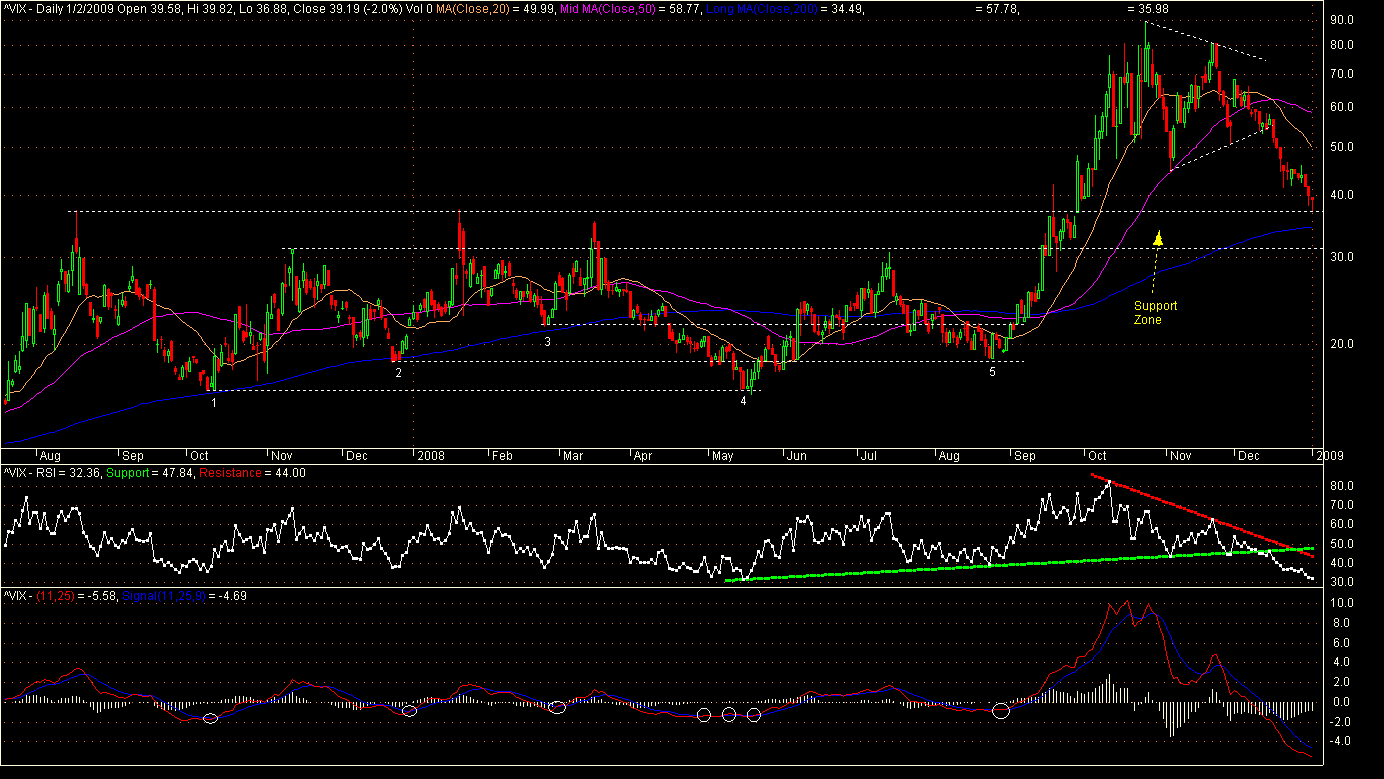
Your target box for the NDX seems to match up well with the support zone for the VIX shown in the chart below. I think 31-37 on the VIX will provide pretty solid support in the coming weeks and could be the launch pad for the next VIX rally. Also, note that MACD is now at the lowest level in the entire 19-yr history of VIX. Since the beginning of the bear market in October '07, a bullish crossover in the MACD when below zero (white circles) has marked a significant low in the VIX (labeled 1-5). I plan on using the next MACD bullish crossover as a signal to get defensive.
KMB
People think the Holy Grail is something looked for but never found. In fact, it is something often found but rarely recognized.
#3
kssmibotm
-
- Traders-Talk User
- 654 posts
Member
Posted 03 January 2009 - 11:54 AM
Your target box for the NDX ...
Sorry. I meant target box for the SPX.
People think the Holy Grail is something looked for but never found. In fact, it is something often found but rarely recognized.
#4
thespookyone
-

- Traders-Talk User
- 6,043 posts
Member
Posted 03 January 2009 - 02:12 PM
Thanks Tea-great and unique takes, as usual!
#5
beta
-

- Validating
- 4,384 posts
lasergirl
Posted 03 January 2009 - 02:47 PM
Tea, that SPX chart is a work of art -- very original.
Only comment I would add is that the lower "C" may hit at a more graduated angle, i.e., later in time, resulting in a lower target.
Thanks for sharing your work.
Edited by beta, 03 January 2009 - 02:49 PM.
"Daytrading -- An Extreme Sport !"


