
Selecto, your charts tell an interesting story
Started by
TheArchitect
, Jan 09 2009 11:10 PM
19 replies to this topic
#1

TheArchitect
-
- TT Member+
- 1,659 posts
Member
Posted 09 January 2009 - 11:10 PM
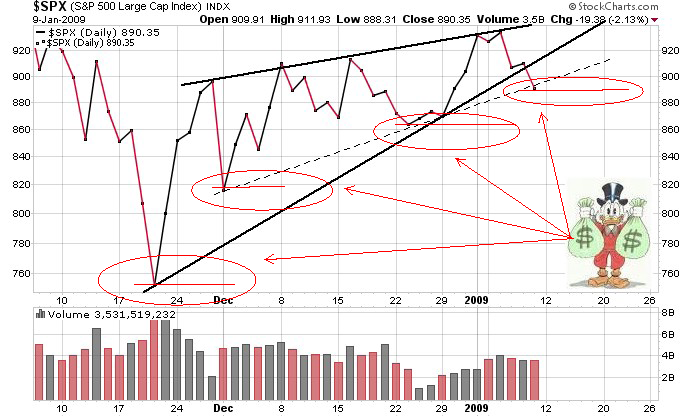
at first sight... may look 'bearish' with the rising wedge... but it clearly says... "higher lows"... watcha think... (hope ya don't mind me marking on your chart)...


#3
Russ
-

- Traders-Talk User
- 7,375 posts
Member
Posted 09 January 2009 - 11:38 PM
at first sight... may look 'bearish' with the rising wedge... but it clearly says... "higher lows"... watcha think... (hope ya don't mind me marking on your chart)...
Wow you are an unrepentant bull, you said on my post of the spx exhaustion gap and h&s formation that you thought 900 would hold and the market was going to rally today...NOT!
The inside support line on Selecto's chart is not the standard way of showing support. Also note that BKX (as noted by OGM) has blown through serious support.
Edited by Russ, 09 January 2009 - 11:38 PM.
"Nulla tenaci invia est via" - Latin for "For the tenacious, no road is impossible".
"In order to master the markets, you must first master yourself" ... JP Morgan
"Most people lose money because they cannot admit they are wrong"... Martin Armstrong
http://marketvisions.blogspot.com/
"In order to master the markets, you must first master yourself" ... JP Morgan
"Most people lose money because they cannot admit they are wrong"... Martin Armstrong
http://marketvisions.blogspot.com/
#4
Russ
-
- Traders-Talk User
- 7,375 posts
Member
Posted 09 January 2009 - 11:56 PM
Note the trendline that has been violated has 3 exact points touching it, 3 or more is considered to be the best for a valid trendline. As selecto said... Quack

"Nulla tenaci invia est via" - Latin for "For the tenacious, no road is impossible".
"In order to master the markets, you must first master yourself" ... JP Morgan
"Most people lose money because they cannot admit they are wrong"... Martin Armstrong
http://marketvisions.blogspot.com/
"In order to master the markets, you must first master yourself" ... JP Morgan
"Most people lose money because they cannot admit they are wrong"... Martin Armstrong
http://marketvisions.blogspot.com/
#5
risktaker
-

- Traders-Talk User
- 582 posts
Member
Posted 10 January 2009 - 01:22 AM
I drew some lines, too.

#6
humble1
-

- Traders-Talk User
- 5,959 posts
Member
Posted 10 January 2009 - 02:27 AM
TA:
i agree about the bullishness of the formation, fwiw. selecto's dotted line tri outlines an ideal "abcde" complex formation which upward corrects (very bullish) the thrust off of the 741 low.
and don't forget Luna; she must always be considered. the dip from wednesday makes a gap-down textbook "e" which finished into this wekend's Full Moon!
the gap down is an exhaustion gap, yes: but the exhaustion is from a long correction. and the news background, an "e" wave signature, was as much as a bull could ask for.
comments?
Edited by humble1, 10 January 2009 - 02:30 AM.
#7
humble1
-
- Traders-Talk User
- 5,959 posts
Member
Posted 10 January 2009 - 03:59 AM
and, btw, how about that kiss-from-above of the slowly upturning 50 dsma?
the charts have  written ALL over them.
written ALL over them.
#8
nicolasillo
-

- Traders-Talk User
- 1,441 posts
Member
Posted 10 January 2009 - 06:27 AM
Humble are you talking about what happened also the last 2 times? 
Lets see if this time is different...we ll find out on Monday. If we have a big red candle you know what it means. Otherwise you are right.
 [/URL]
Lets see if this time is different...we ll find out on Monday. If we have a big red candle you know what it means. Otherwise you are right.
[/URL]
#9
humble1
-
- Traders-Talk User
- 5,959 posts
Member
Posted 10 January 2009 - 07:29 AM
nico:
exactly, sort of! except in this anti-verse the red = white. you have intuitively looked at part of the folkback/foldunder. i don't need to ™ that one, lol: it has been used for generations by traders.
and one of those dates, the 9/2, is part of the pattern. there is no software, that i know of, which can adjust that type pattern to an overlay. the use of popular software alone is one of the reasons 95+% lose their butts in these markets.
Edited by humble1, 10 January 2009 - 07:32 AM.
#10
nicolasillo
-
- Traders-Talk User
- 1,441 posts
Member
Posted 10 January 2009 - 07:36 AM
I have a chart, that I will post if it happens, so far it works fine since the early Oct lows, that tells me we see a low around 22-26 Jan and then rally to early Apr. Now, whether we see new lows is another question because the time span is too narrow but you never know.


