
Despite financial crisis, it behooves the Street and investors to ignore common sense and historical precedent that show debt to be the only source of growth and liquidity. In his essay titled Its Just Time, Martin Armstrong makes a case for cyclical downturn that comes as regularly as seasons of the year and tidal waves. Whatever causes debt blowoff to move into its terminal stage---- like Roseanne Roseannadanna would say Well it just goes to show you, it's always something, you either got a toenail in your hamburger or toilet paper clinging to your shoe. Alas, this is the money system that our predecessors adapted and were stuck with it.
Recently Steve Balmer of Microsoft was quoted sketching a dire portrait of the world economy, likening it to market conditions in 1837, 1873, and 1929, each of which involved bank failures, high unemployment, and a depression. This is a once-in-a-lifetime economic crisis. There is a lot of history around that, and frankly if you stop and think about it, 1837, '73, '29, 2008, it's almost exactly a whole lifetime between each of the major economic difficulties that we face." Ballmer said that economic growth in the last 25 years was fueled by innovation, globalization, and debt--and that the current levels of debt were unsustainable. "In 1929, for example, just before the stock market crash, the private debt-to-GDP ratio was 160 percent," he said." (1)
Steve Balmer knows something that most people on Wall Street dont. In fact, majority is clueless about the oncoming financial tsunami that will befall global economies.
Source: BEA, Federal Reserve
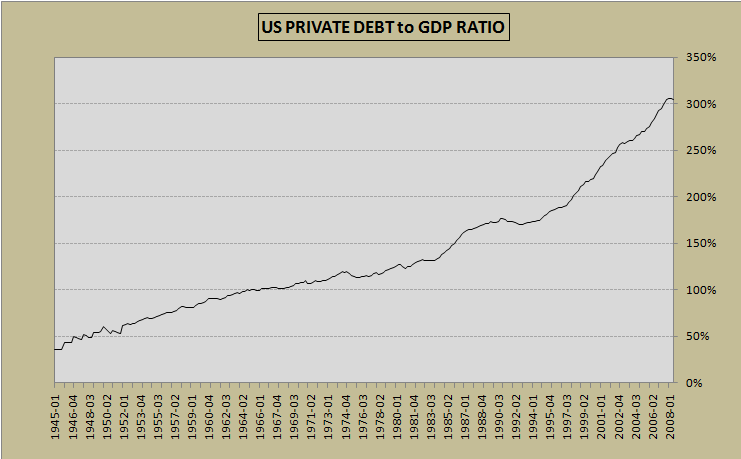
The chart above shows the relationship of US Private Debt (non government debt) as ratio of US GDP in current dollars from 1945 to 2008. Already in late 2007, it stood at over 300%. There are number of variations of this chart some showing earlier historical data from 1920s with debt ratio in range of 160-300%. This chart omits government debt for obvious reasons that US Government debt was not defaulted during Great Depression, and without earliest data as source of these figures cant be reliably verified.
But, the key observation is that at the end of 1945(earliest year Federal Reserve provides credit data), total private debt stood at just 36% of GDP.
According to Steve Keen (2), Assistant Professor at University of Western Sydney, private sector debt to GDP ratio in 1933 stood at about 240%. With GDP at $56.4 billion in 1933 that would put private sector debt at about $135 billion. In comparison, in 1945 private total debt was at just $79.5 billion, or 41% lower than in 1933. Further, the data points out to even larger debt collapse when using the 160% debt to GDP ratio in 1929. As annual GDP in 1929 was $103.6 billion, total private debt could be estimated at $165 billion, which corresponds to Hosington Management Associates (3), $163 billion total debt in 1933.
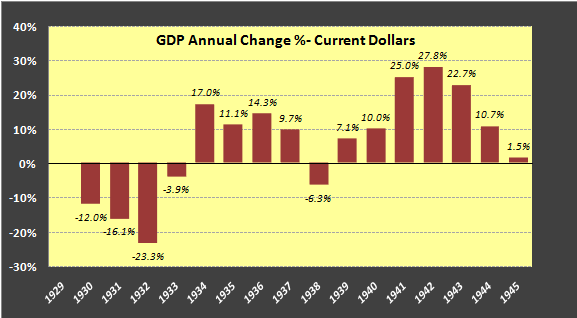
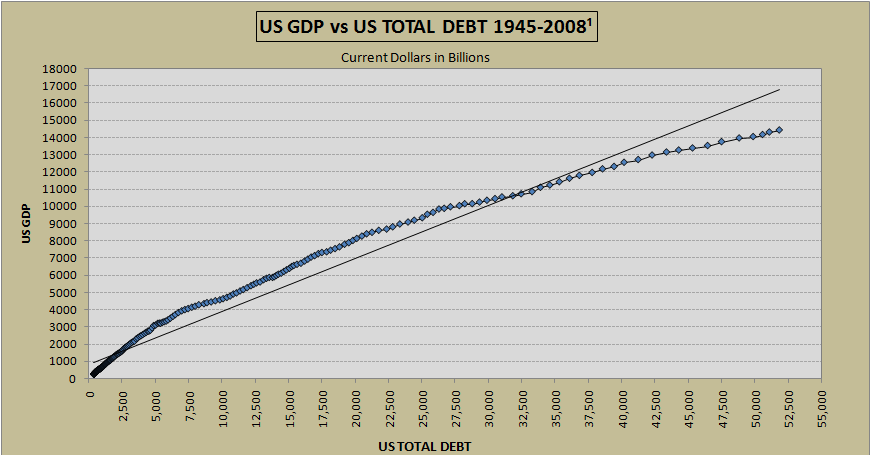
The chart above shows the GDP contraction during 1929-1933. From the peak of 1929 to the bottom in 1933, GDP declined 45.5%. The corresponding magnitude of debt destruction of 41%-52% closely follows this. The correlation of GDP and debt is striking: its has coefficient of correlation of about 98%. This relationship is graphed in the chart below.
Source: BEA , Federal Reserve
With total private debt standing at $43796 billion at the end of 3rd quarter in 2008, a similar purging of the debt like occurred during Great Depression would cause a loss of some $23 trillion to the financial sector and a decline of GDP to about $10 trillion dollars. This would bring private debt ratio to more reasonable level of about 220%, but, a far cry from 1945 level , and still too high to restart credit expansion.
This malaise will last a very long time and almost no one understands this; almost all of private sectors debt needs to be purged from the system---that is over $44 trillion.
Edited by linrom1, 13 February 2009 - 04:28 PM.


