Jump to content


Photo

Daily SPY needs an acceleration of volume to break and hold 80.05


  • Please log in to reply
2 replies to this topic

#1 unosuke

unosuke

    Member

  • Traders-Talk User
  • 417 posts

Posted 15 February 2009 - 06:24 PM

Yesterday I discussed the SPY busting into its low on an hourly.

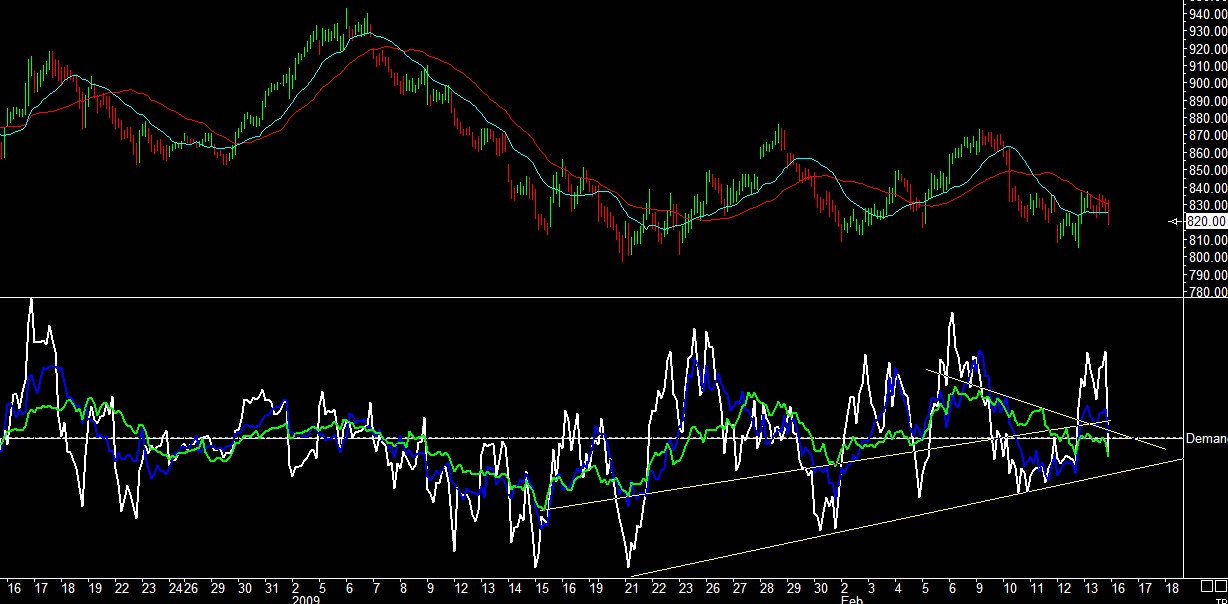
Here's a look at the daily parameters.

Posted Image

Posted Image

Posted Image

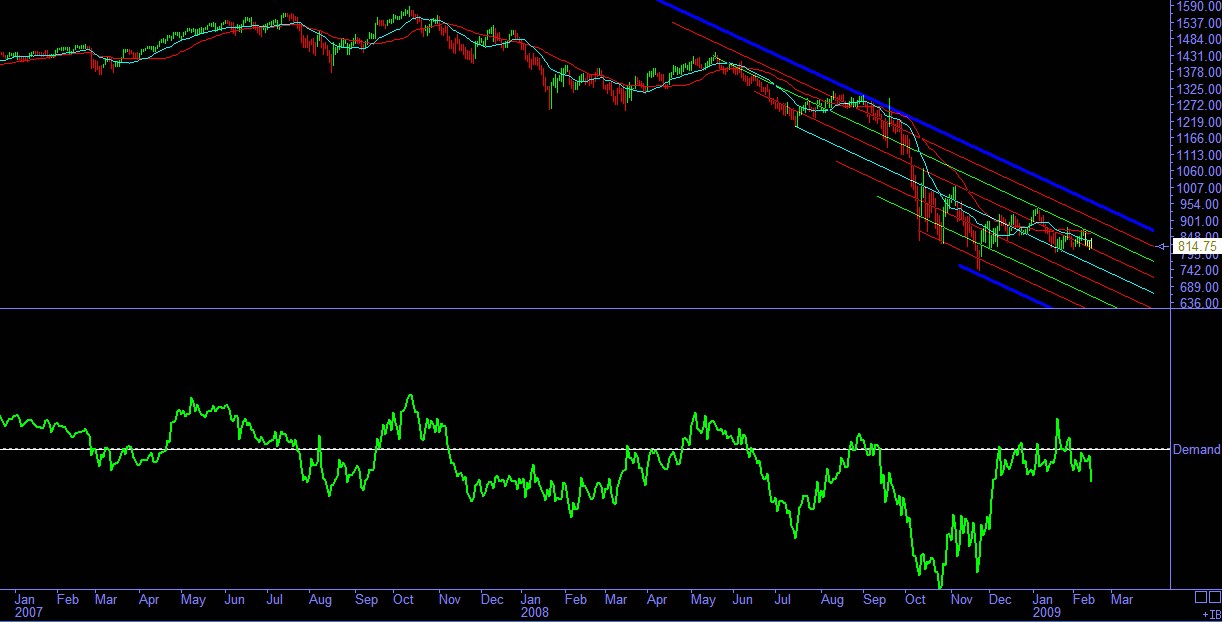
Live Euro chart, or should be live. . .(quotes.ino.com)
Posted Image

Current Positions: Long EEV @ 40.29, Long DUG @ 24.66, Long DXD @ 59.62, Long SDS @ 72.70, Long TWM @ 61.84, Long QID @ 48.21, Long FXP @ 20.43, Long SSG @ 43.76, Short XOM @ 69.31, Short AAPL @ 117.52

#2 VolPivots

VolPivots

    Member

  • Chartist
  • 3,203 posts

Posted 15 February 2009 - 09:40 PM

Looks to me like demand is waning, and the bulls are in a potentially vulnerable situation nearby.......

Attached Thumbnails

  • 3_2009_02_15.jpg


#3 VolPivots

VolPivots

    Member

  • Chartist
  • 3,203 posts

Posted 15 February 2009 - 09:44 PM

last chart was the daily e-minis....here's the 45min. shortest term demand in white is close to testing the uptrend line, while the longest term demand line in lime already broke it's uptrend line from mid Jan and is now downtrending. Volume weighted resistance now resides mid 830s.

Attached Thumbnails

  • 4_2009_02_15.jpg