
Member
Posted 22 January 2010 - 12:23 AM
Member

Posted 22 January 2010 - 04:43 AM
Member
Posted 22 January 2010 - 05:31 AM
Hi,
What target and time frame are you looking for re this drop on the ASX ?
Member
Posted 23 January 2010 - 12:32 AM
Hi,
What target and time frame are you looking for re this drop on the ASX ?
Bear
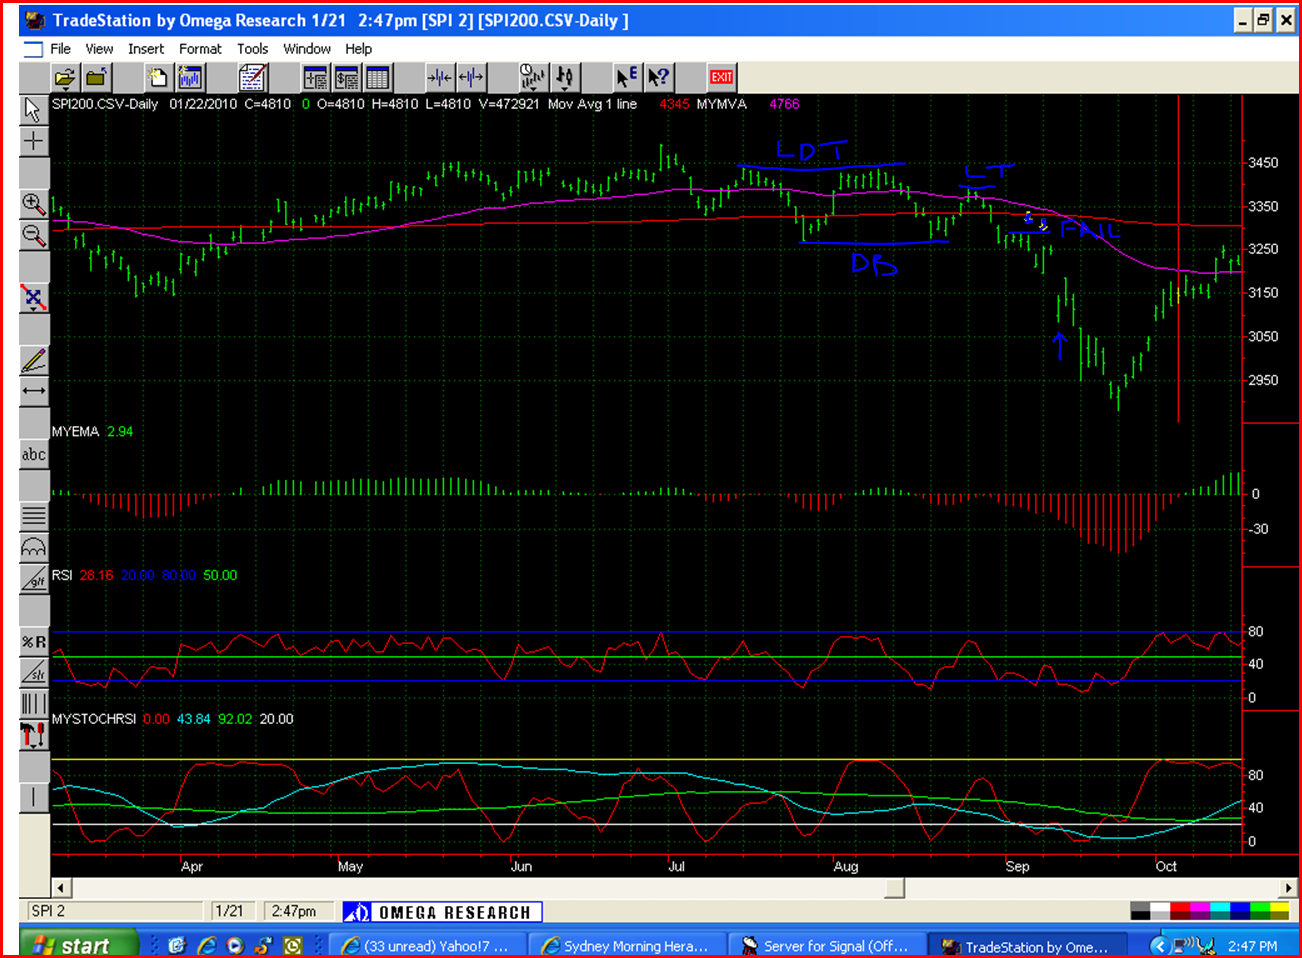
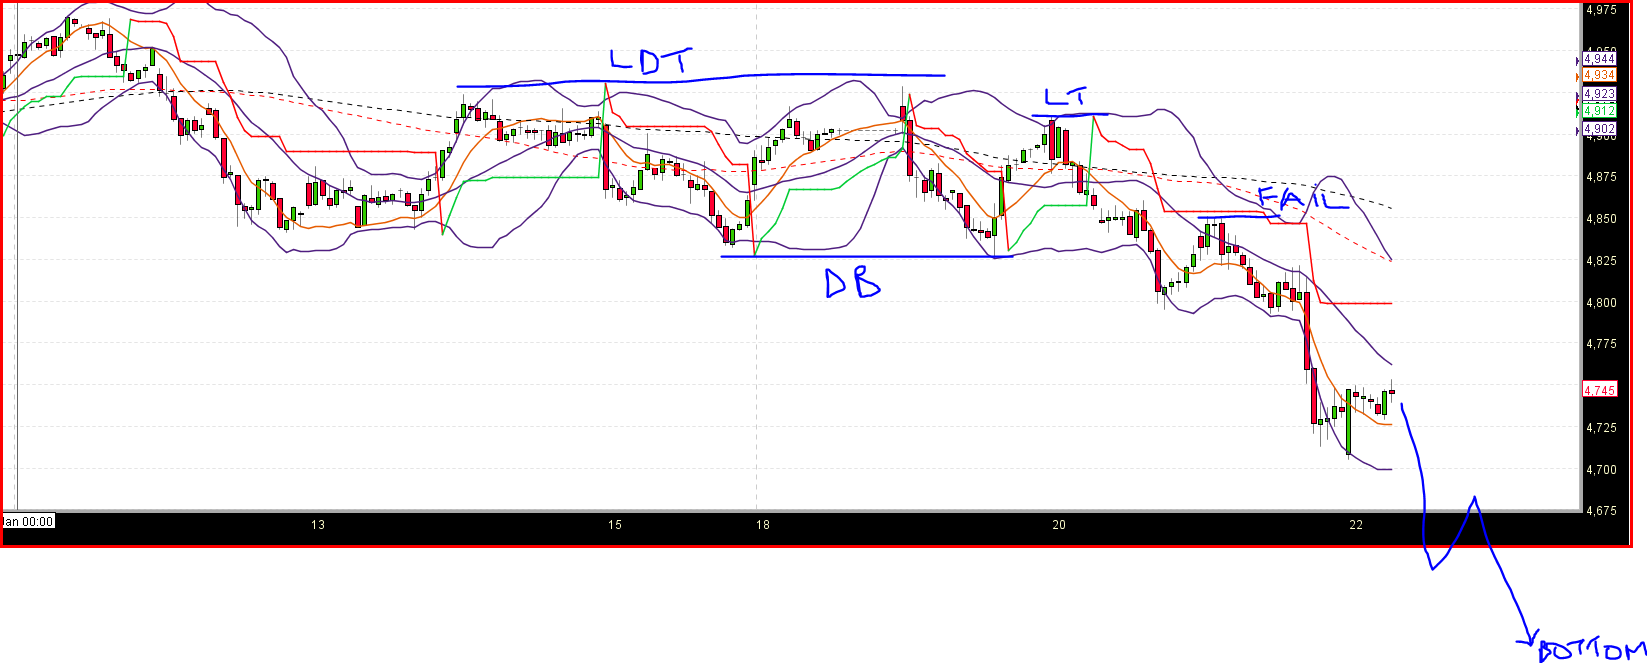
Because we are comparing hourly (including 24 hour trading) against daily, it could complete the pattern by Monday at the earliest or the next trading day at the latest I suspect.
Australia has a holiday on Tuesday which complicates things and in fact may be a reason to end weak on Monday.
Of course that won't happen if the US has a very positive session today (Friday) you would think.
Believe it or not the Aussie market seems to lead the US market most days. Of course it is not leading the US but seems to have an uncanny sense of what the US will do in its next session. It is interesting in that you would think that US overnight futures would then be paralleling the Australian market but it seems not to work that way most of the time. I can only suspect that US parties are participating in the Aussie market but for some reason don't wish to show their hand in the US market. Is it because of data sensitive inside information that would be too obvious if traded in the US. I have my suspicions but no proof.
Anyway, the Aussie market did not rebound today to any degree so does not see a huge rebound in the US this coming session. Of course we don't always get it right or it would be too easy. Still I think if a study was done on following the Aussie lead then it would show it as a nice system.


