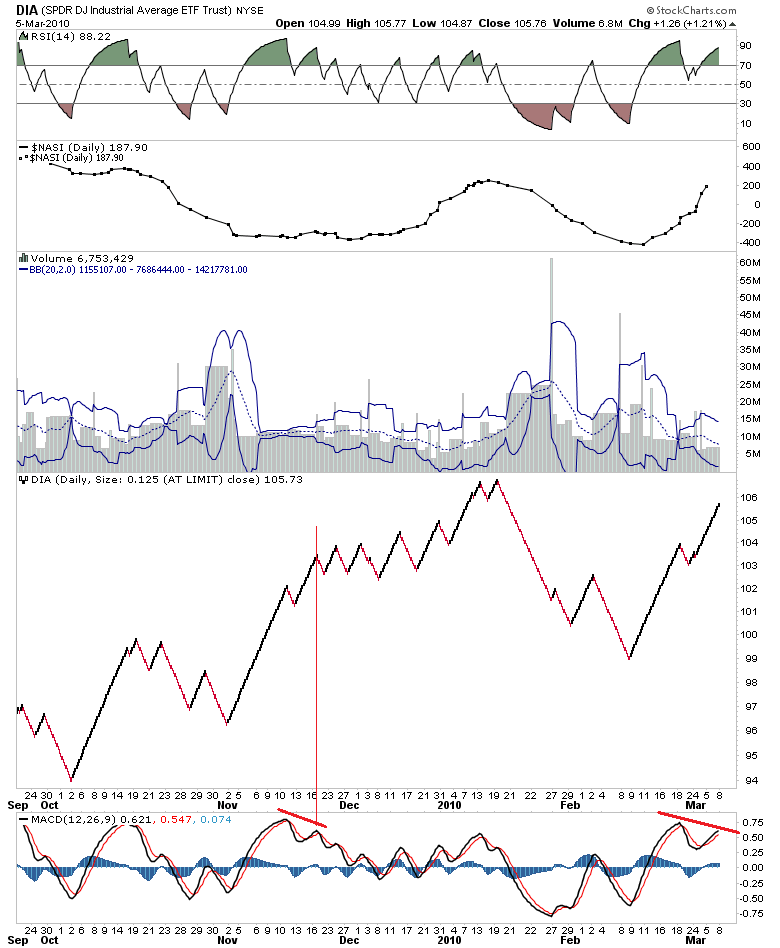
the 14 day stochastic has drastically diverged from the 8 day MACD.
the most bearish implication is that the russell 2k made a new high but the NYA has not...this is extremely bearish and throughout 150 years of trading
when russell formed this index this as ALWAYS lead to a crash on monday

major divergence at the close today
Started by
atlasshrugged
, Mar 05 2010 05:08 PM
18 replies to this topic
#2

tomterrific14
-

- Traders-Talk User
- 1,451 posts
Member
Posted 05 March 2010 - 05:32 PM
the 14 day stochastic has drastically diverged from the 8 day MACD.
the most bearish implication is that the russell 2k made a new high but the NYA has not...this is extremely bearish and throughout 150 years of trading
when russell formed this index this as ALWAYS lead to a crash on monday
http://stockcharts.com/charts/gallery.html...6;NYA:$RUT Does this chart buttress your implication.? From July to Sept 2008, the market crashed when there was such glaring underperformance of the NYA relative to the RUT.?
Does this trend portend more than a one day crash on Monday.?
Mark Hulbert's survey of advisory sentiment is the most bullish in the past 3 years. I saw a chart with the latest readings of bullishness in the AAII survey, also the most bullish in 3 years.
Are all those on the bullish bus going to Vegas with their paper profits, or will that 'bus' get a flat tire , en route.?
#3
IYB
-

- TT Patron+
- 7,157 posts
Member
Posted 05 March 2010 - 05:37 PM
You are mean man Atlas.the 14 day stochastic has drastically diverged from the 8 day MACD.
the most bearish implication is that the russell 2k made a new high but the NYA has not...this is extremely bearish and throughout 150 years of trading
when russell formed this index this as ALWAYS lead to a crash on monday
 Didn't the forest ranger ever tell you not to tease the bears?
Edited by IYB, 05 March 2010 - 05:42 PM.
Men, it has been well said, think in herds; it will be seen that they go mad in herds, while they only recover their senses slowly, one by one. ― Charles Mackay, Extraordinary Popular Delusions and the Madness of Crowds
#4
atlasshrugged
-
- TT Patron+
- 4,409 posts
Member
Posted 05 March 2010 - 05:58 PM
You are mean man Atlas.the 14 day stochastic has drastically diverged from the 8 day MACD.
the most bearish implication is that the russell 2k made a new high but the NYA has not...this is extremely bearish and throughout 150 years of trading
when russell formed this index this as ALWAYS lead to a crash on monday
lol...actually my point is to make clear how dangerous posters can be to those who are new and want to learn the "correct" way to "interpret" signals.
yes TA is arbitrary but there are "common" things that form the foundation for tech analysis...like drawing a simple trendline from connecting the lows...right!
or correctly interpreting what a "divergence" is
I blew up my book at Merrill when i was a young broker in the early 90's from following people i thought knew what they were doing..
#5
atlasshrugged
-
- TT Patron+
- 4,409 posts
Member
Posted 05 March 2010 - 06:28 PM
basic "principle" tools of technical analysis have to be accepted and obeyed by the participating parties for the mkt to trend at all...other wise you would never have trends and the mkt would just move in random fashion...and it doesnt...
its the same reason we have laws...to prosecute those that yell fire in a crowded strip bar...especially when i have two more songs coming on my trifecta lap dance
Edited by atlasshrugged, 05 March 2010 - 06:29 PM.
#6
tomterrific14
-
- Traders-Talk User
- 1,451 posts
Member
Posted 05 March 2010 - 06:58 PM
the 14 day stochastic has drastically diverged from the 8 day MACD.
the most bearish implication is that the russell 2k made a new high but the NYA has not...this is extremely bearish and throughout 150 years of trading
when russell formed this index this as ALWAYS lead to a crash on monday
http://stockcharts.com/charts/gallery.html...6;NYA:$RUT Does this chart buttress your implication.? From July to Sept 2008, the market crashed when there was such glaring underperformance of the NYA relative to the RUT.?
Does this trend portend more than a one day crash on Monday.?
Mark Hulbert's survey of advisory sentiment is the most bullish in the past 3 years. I saw a chart with the latest readings of bullishness in the AAII survey, also the most bullish in 3 years.
Are all those on the bullish bus going to Vegas with their paper profits, or will that 'bus' get a flat tire , en route.?
tom where in the funk do you come up with AAII being the most bullish in three years...where in the funk do you come up with such bs
To the first point about advisory sentiment as measured my Mark Hulbert:
http://www.marketwat...03-05?dist=news
I'll see if I can find the chart on the AAII Sentiment survey again and will post the link here if I can find it again
#7
atlasshrugged
-
- TT Patron+
- 4,409 posts
Member
Posted 05 March 2010 - 07:03 PM
the 14 day stochastic has drastically diverged from the 8 day MACD.
the most bearish implication is that the russell 2k made a new high but the NYA has not...this is extremely bearish and throughout 150 years of trading
when russell formed this index this as ALWAYS lead to a crash on monday
http://stockcharts.com/charts/gallery.html...6;NYA:$RUT Does this chart buttress your implication.? From July to Sept 2008, the market crashed when there was such glaring underperformance of the NYA relative to the RUT.?
Does this trend portend more than a one day crash on Monday.?
Mark Hulbert's survey of advisory sentiment is the most bullish in the past 3 years. I saw a chart with the latest readings of bullishness in the AAII survey, also the most bullish in 3 years.
Are all those on the bullish bus going to Vegas with their paper profits, or will that 'bus' get a flat tire , en route.?
tom where in the funk do you come up with AAII being the most bullish in three years...where in the funk do you come up with such bs
To the first point about advisory sentiment as measured my Mark Hulbert:
http://www.marketwat...03-05?dist=news
I'll see if I can find the chart on the AAII Sentiment survey again and will post the link here if I can find it again
go to sentimentrader.com...jason has a gazillion years of the history..its no where near overly bullish

#9
mcleert
-

- Traders-Talk User
- 480 posts
Member
Posted 05 March 2010 - 07:46 PM
come on guys---charts, surveys, sentiment, divergence-------all are probability tools.
Have you ever watched a basketball game when the losing team needs a 3 point shot
from 30-50' away to win the game? What is the probability or divergence.
Today before open ---probability says go short ---the unemployment report was going to be awful.
It came in (does not matter if correct)---not bad.
3 point shot went in--not pretty but went in.
Divergence at the close----different from the mean---so what!!!
#10
snorkels4
-

- Traders-Talk User
- 2,677 posts
bad guy
Posted 05 March 2010 - 07:50 PM
clk, what kind of targetHere you go IC.

looks like 2003?
http://1.bp.blogspot.../s1600-h/52.png
Edited by snorkels4, 05 March 2010 - 07:51 PM.
Andy House, Texas Man, Accidentally Drives 2006 Bugatti Veyron Into Salt Marsh
http://www.zimbio.co...Veyron Crashing
http://www.zimbio.co...Veyron Crashing


