Posted 08 March 2010 - 04:29 AM
good stuff guys
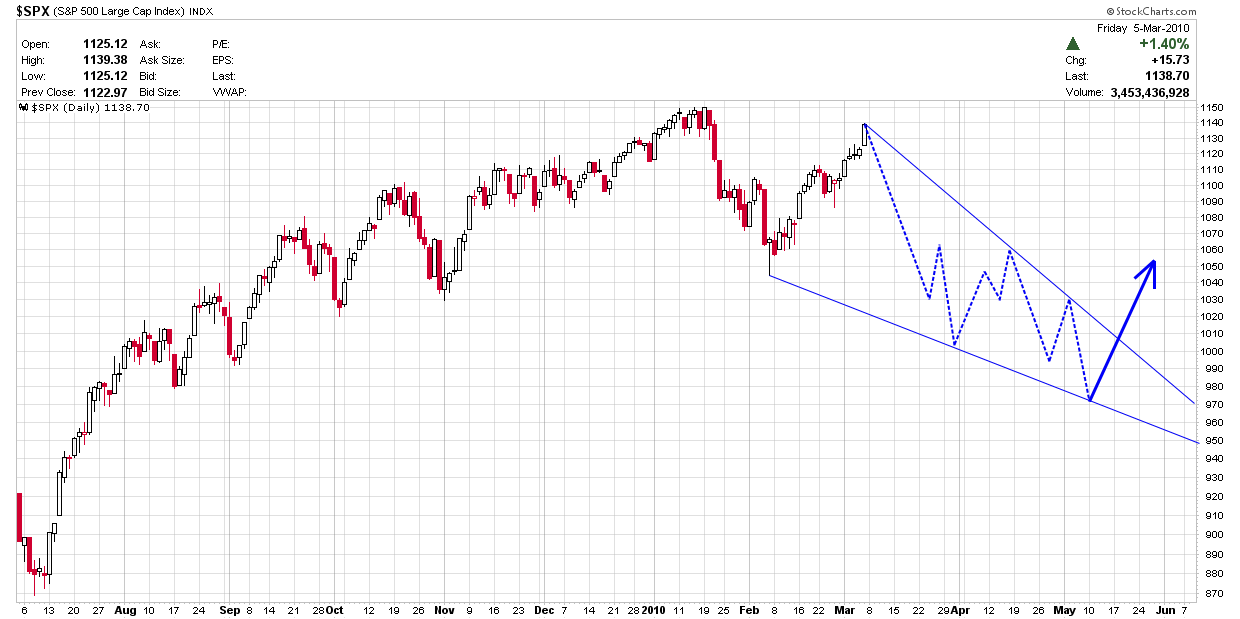
I'm looking at two possibilities right now--first, an inverted head/shoulders bottom with a midpoint of course at the feb low of 1044.5, and a left shoulder at 1104.73, right shoulder (as of now) at 1112.29. If you draw a neckline across the highs connecting shoulders to head, you get a trend line intersected around 1116.50 (actually we gapped over it last Tuesday morning by opening at 1117) but for price target purposes the point of intersection is important--so lets call it 1116 and a half for now. With an inverse h/s, often the very first pullback after the intersection, or the gap up in our case, should bounce off the neckline then head upwards towards the pattern price target. Last Thursday, we put in a low at 1116.66 which would satisfy the bounce off of the neckline requirement--and if this pattern completes, the SPX is headed to 1186.
Few things are questionable about the pattern though--first, volume literally should explode coming out of the right shoulder. This definitely didnt happen. But at a minimum, there should be no down days of higher volume than green days once the ascent begins out of the right shoulder--this does hold up, but again, volume definitely didn't impress. Second doesnt pertain just to the pattern but a general comment-the price action was outright lousy at times last week, esp if you're bullish. The low volume selling that was able to take the market down at times mid-week was just sad, and even sadder still that buying volume was low enough to let the market drop. volume definitely picked up towards the end of the week, but IMO you can attribute the increase, and perhaps alot of the up volume overall, to short covering after the payroll numbers.
before I move off of this pattern, i will note that the symmetry is bullish here--for example, the neckline is sloping upwards--obviously very bullish and usually indicates the pattern will complete. The height of each shoulder almost matches the head exactly, and all three portions of the pattern completed in the same amount of time--roughly 5-7 days from entry to exit points. again, very bullish, as anyone who trades classic h/s tops knows how important symmetry can be when it comes to the patterns' reliability. (note theres also an inverse h/s setting up on the spx weekly too--dec 09 through now would set up as the right shoulder, very symmetrical to the 14 weeks from late June 2008 through end of september. Ironically, the left shoulder completed and moved lower with the gap down to 1098, and the possible right shoulder coming out began with a gap up from 1102 to 1105. Of course the price target if this one holds would be pretty high--and its not something I'm trading as of yet...just something to watch).
Finally- by closing well above 1127 last week, we've surpassed all of the key fib levels that would classify this run up as a retracement of the move down. Obviously the final test comes at the 99% retracement level--1150.35. A close above 1150.35 would not only be a 52 week high, but it would be confirmation of a new wave up , as opposed to a final corrective wave up in an ongoing leg down from Mid january.
thats all Ive got for now. FWIW, I'm 65% long 35% short. This is far more weighted to the short side than I've been in any sort of confirmed upward movement since last May--but as I said, I just didnt care for the price action last week, nor the put/call ratios on the indices and index ETFs. In addition, sources are claiming that the majority of hedge fund money is short the spx right now. I wont argue that was true in January. Is it still true now? Cant be sure....but if it is, technicals certainly have to take this into consideration, so thats adding to my caution here. Normally I'd be long some SPX or SPY calls, but I'm holding all individual stocks now instead, and actually using SPY puts, and a combination of bearish option strategies on large cap stocks that move generally with the SPX, to protect myself in case of a move down. I just dont know how anyone could be all long anywhere above 1110 right now.

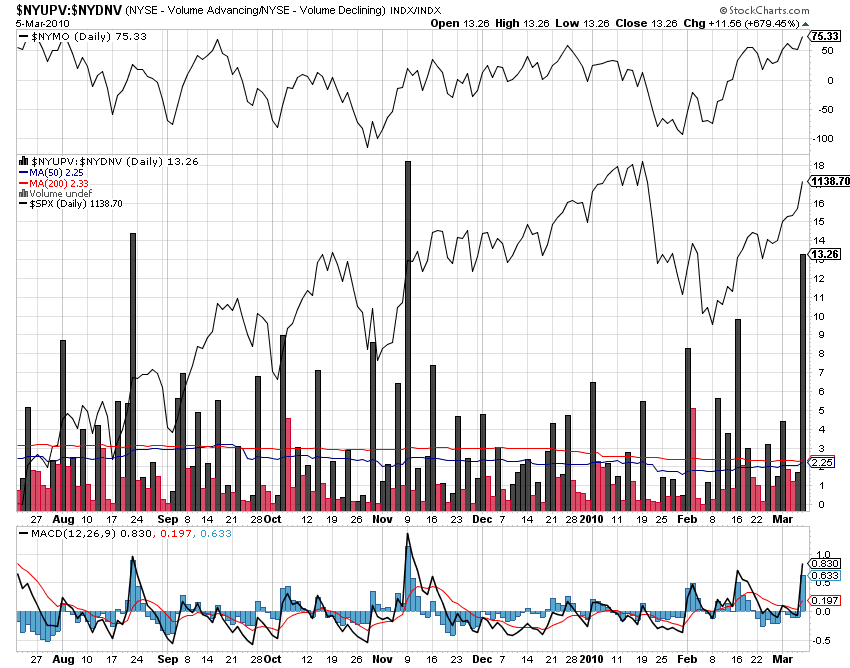 one gathers from chart above that upvol/dnvol more than 10 (SEE previous occasions above of 10+ ratio in aug & nov )is likely to happen near swing high (not low)..this is akin to "buying exhaustion" as shorts stampede to cover giving an impression of a longs-led rally..., NYMO obviously was way overbought on all 3 occasions...
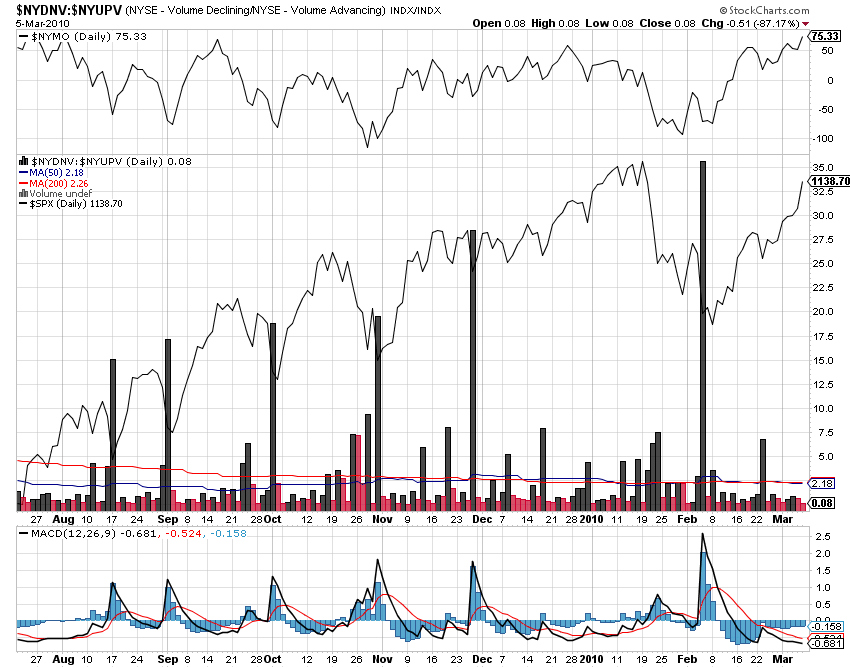
lets see the reverse. down vol/ up vol. Here a spike heralded swing low that is selling exhausion (bears were excited needlessly)...but observe that this ratio is spiking more & more as the rally ages (giving rise to suspicion that forces-behind-doors have to fight ever more intensely not to yield to market forces)
one gathers from chart above that upvol/dnvol more than 10 (SEE previous occasions above of 10+ ratio in aug & nov )is likely to happen near swing high (not low)..this is akin to "buying exhaustion" as shorts stampede to cover giving an impression of a longs-led rally..., NYMO obviously was way overbought on all 3 occasions...
lets see the reverse. down vol/ up vol. Here a spike heralded swing low that is selling exhausion (bears were excited needlessly)...but observe that this ratio is spiking more & more as the rally ages (giving rise to suspicion that forces-behind-doors have to fight ever more intensely not to yield to market forces)
 So it remains to be seen if last wk rally has depleted the fuel or not...


