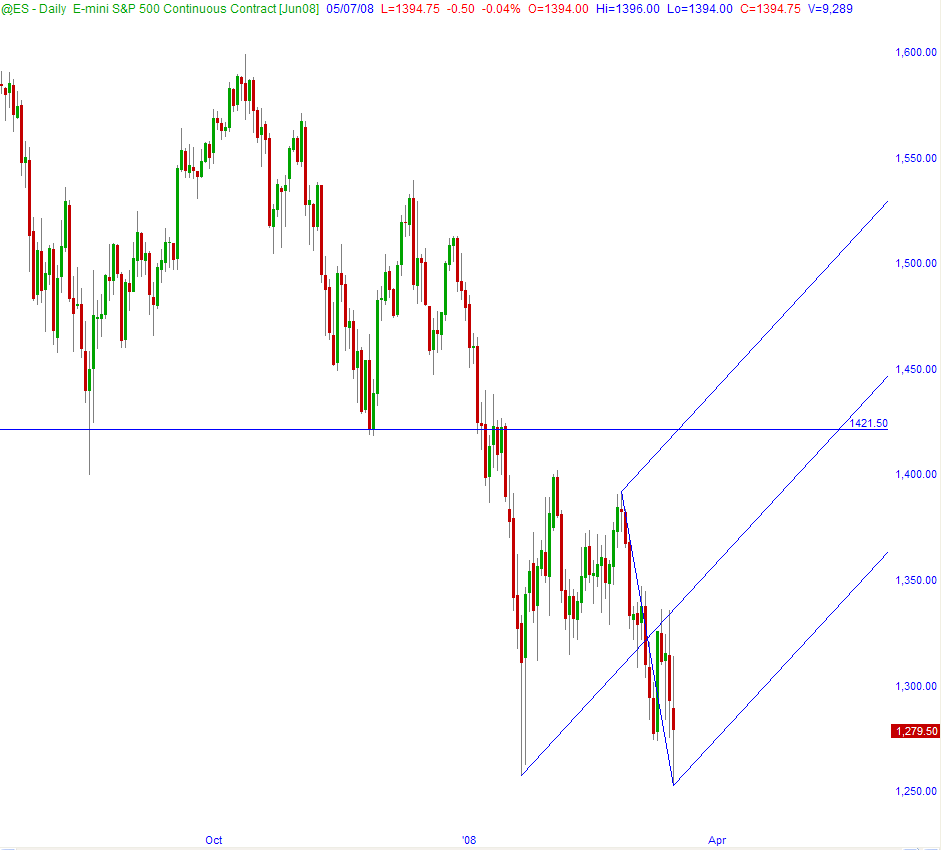
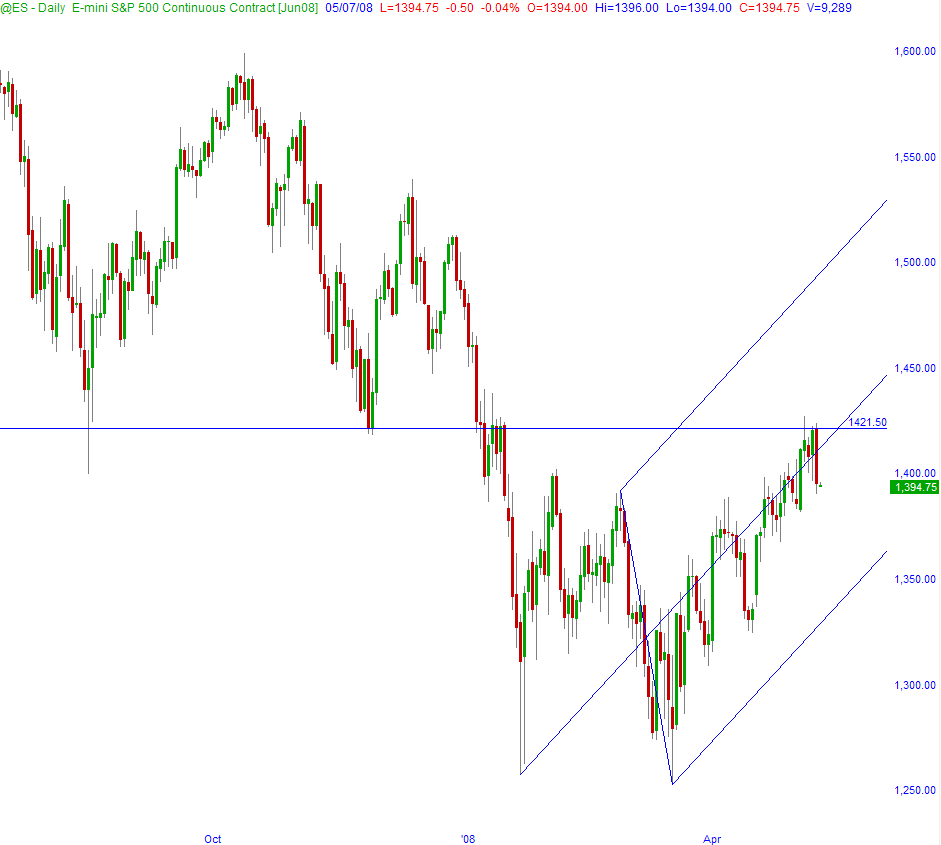
Edited by swinger, 07 May 2008 - 06:02 PM.
ES Then and Now
Started by
swinger
, May 07 2008 06:00 PM
5 replies to this topic
#1
Posted 07 May 2008 - 06:00 PM
This first chart shows what the ES looked like at the close after the March 17, 2008 low. I drew in a trident channel back then which targeted a high on May 16th (which happens to be May Options Expiration Day) at 1421. That was the target I was shooting for off the bottom (and got).
ES 1421 (adjusted for continuous futures contract) has been an extraordinarily important number since May of 2006. There has been a major breakout and a major breakdown and three major lows followed by giant rallies and now a significant test from underneath. If there is one line that clearly defines bull versus bear market--1421 is it.
#3
Posted 07 May 2008 - 06:58 PM
Swinger,
Thanks for the meticulous, careful work. I follow your posts religiously, along with a few others here, Linrom, Arbman, Semibizz, Teaparty, Nav, A-ha, Rodgerdodger, Insider, Spectacular_Bid, Nicosallilo...
Hey wait, there's a lot of great posters here!
Best board I've ever been on.
Keep up the great work - all of you- it's much appreciated.
Deva
#4
Posted 07 May 2008 - 06:58 PM
Sorry, multiple posts!
Edited by dowdeva, 07 May 2008 - 07:00 PM.
#5
Posted 07 May 2008 - 06:58 PM
Edited by dowdeva, 07 May 2008 - 07:00 PM.
#6
Posted 07 May 2008 - 06:59 PM
lol
Edited by dowdeva, 07 May 2008 - 07:01 PM.


