http://www.traders-t...?...55&hl=skott
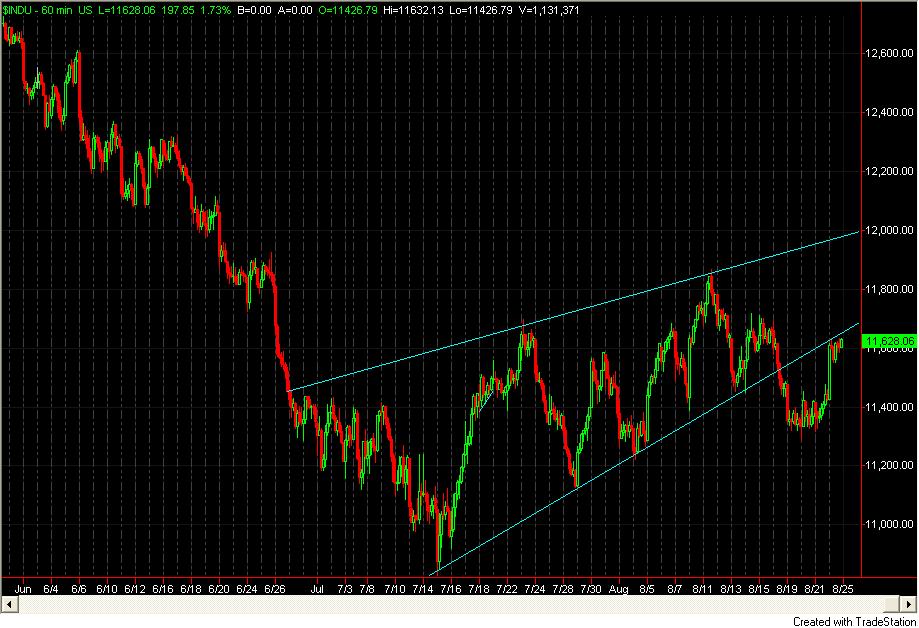
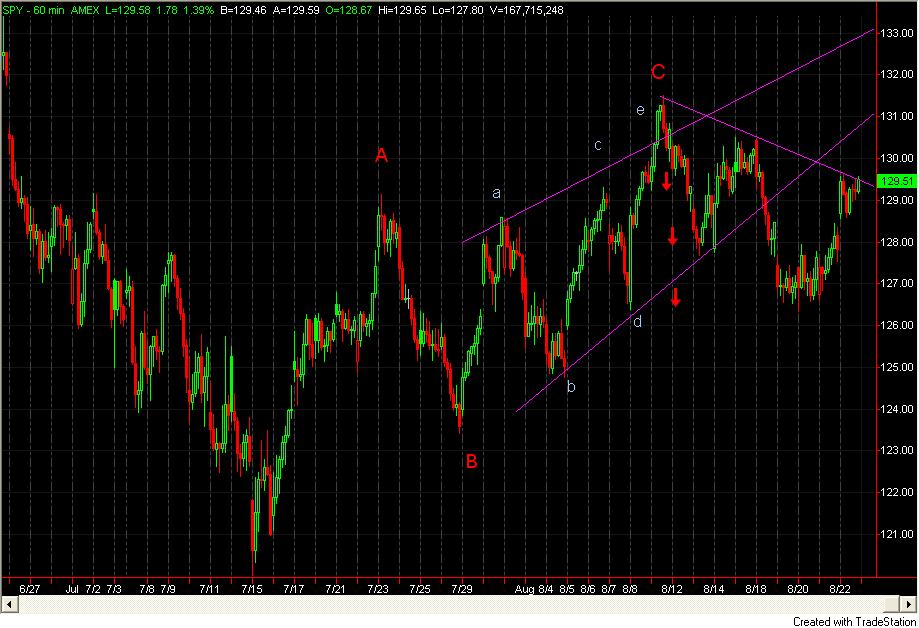
You may remember the chart I showed and labeled. Here it is again and we have had the break and the normal test of that line from the underside. What was support is of course now resistance. Also the retrace we've had since the August 11 top is a fib 61.8% and the end of the rise could be an ending diagonal.
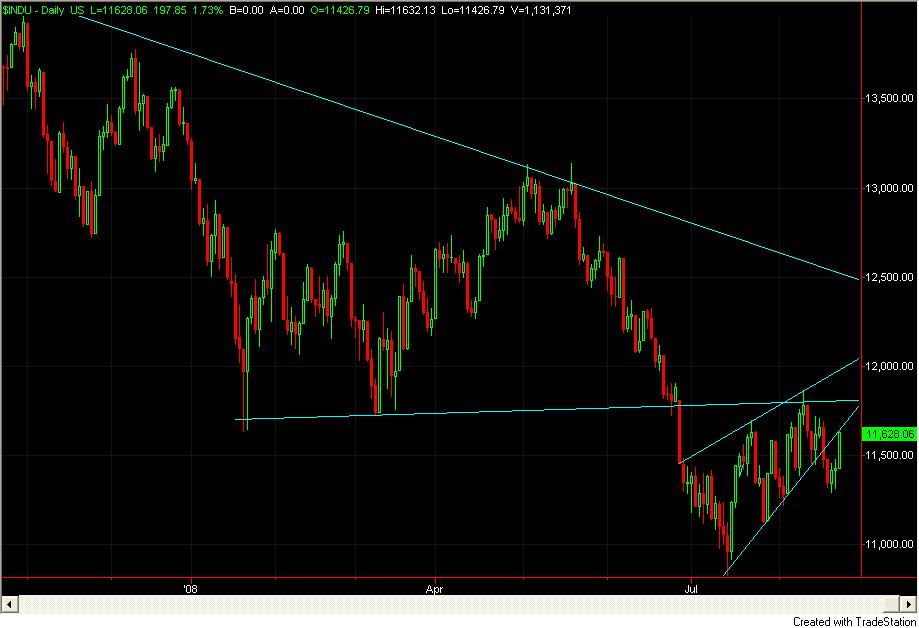
The Dow action looks the same with a longer time frame look on this chart