The bearish H&S's are in the stock market....... Dow and S&P, etc and on different time frames. And of course we have some massive ones spanning a couple years. We could rise a little early tomorrow to maybe even 1281(maybe). If it does get there..... it's a short and sets up a bearish expanding wedge
The inverse pattern is there in gold. Maybe some charts later if I have time
Don't forget Russia!

I see alot of Head and Shoulders Patterns
Started by
skott
, Aug 27 2008 01:57 AM
17 replies to this topic
#2

skott
-
- Traders-Talk User
- 4,712 posts
Member
Posted 27 August 2008 - 08:24 AM
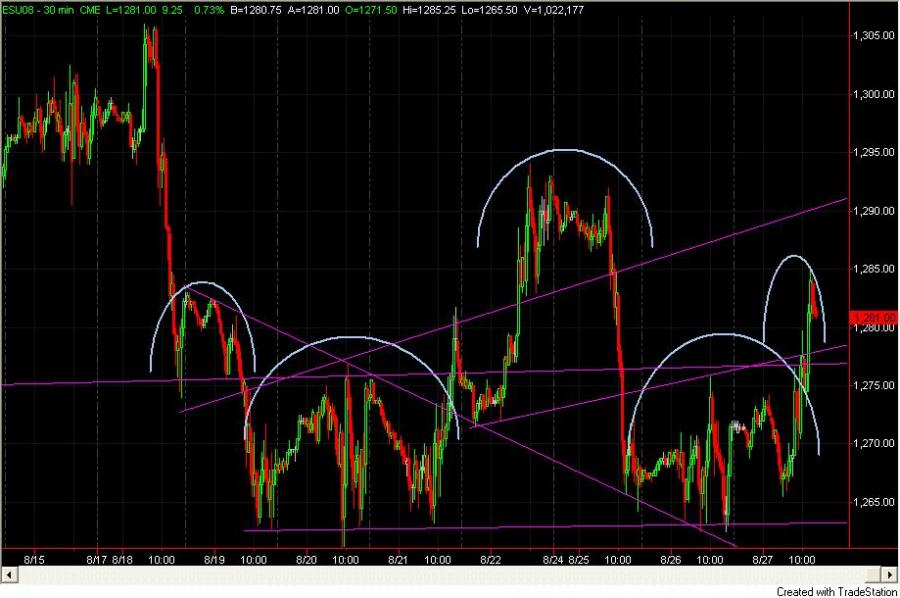
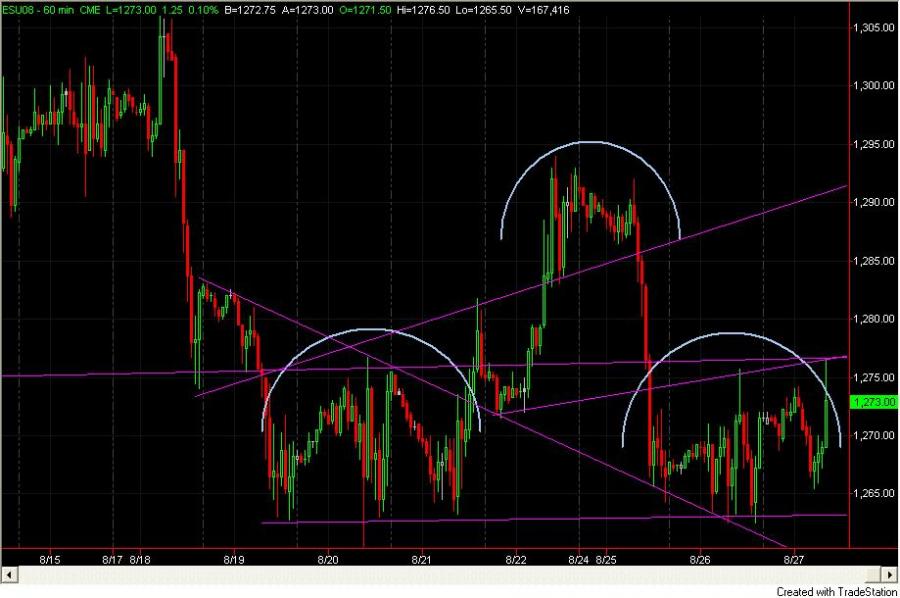
First a chart of the S&P e mini futures. If it breaks down (and it won't until below 1261) projects 1210ish
#3
skott
-
- Traders-Talk User
- 4,712 posts
Member
Posted 27 August 2008 - 08:44 AM
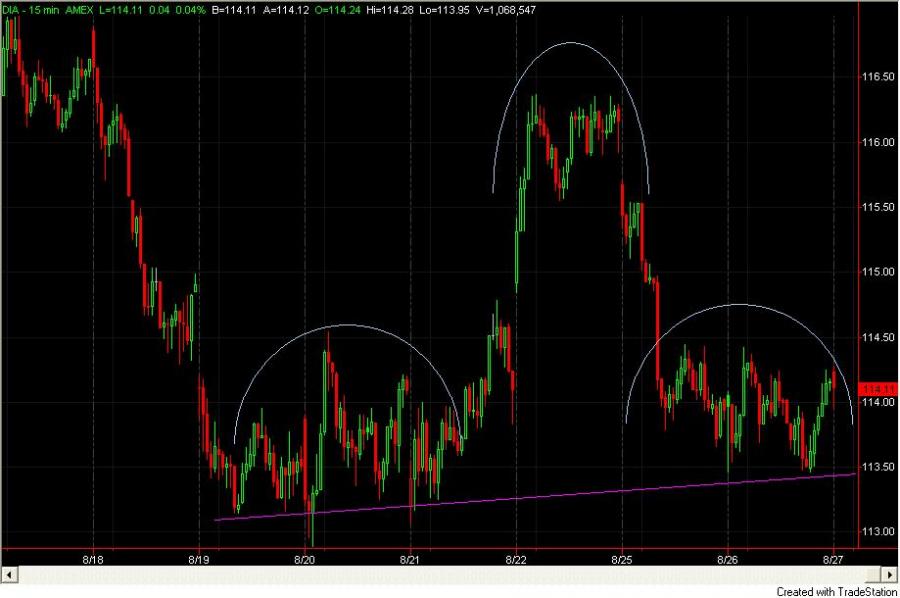
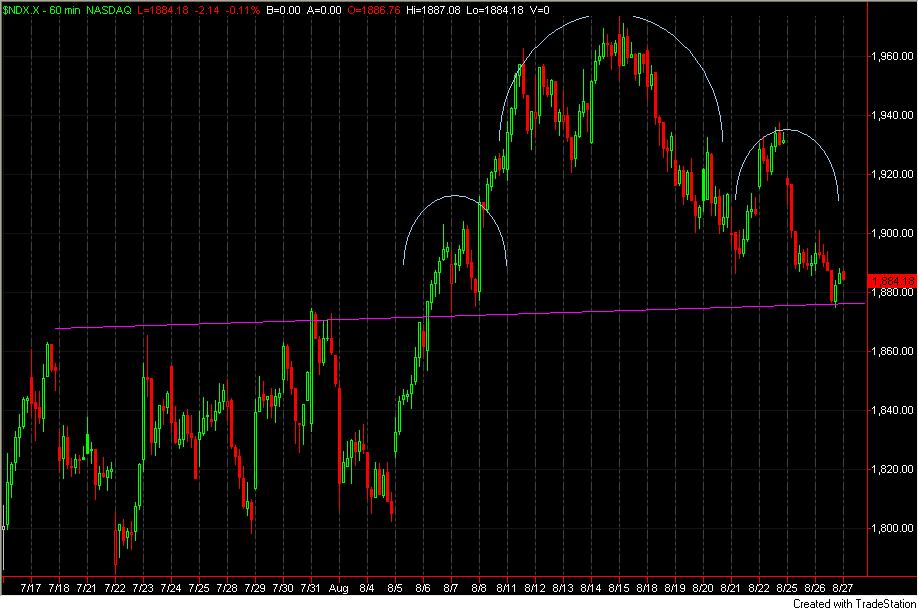
Dow looks the same as the e mini...... I did this one with the proxy for the Dow (DIA)
 Maybe I am stretching it a bit on the ndx but I don't think so. Of course none of these have broken down to give the targets except for the Huge Dow H&S which is over several year period in it's formation. I posted it on the previous thread
 By the way TTHQ, I love the new (new to me anyway) chart upload feature
#4
skott
-
- Traders-Talk User
- 4,712 posts
Member
Posted 27 August 2008 - 08:49 AM
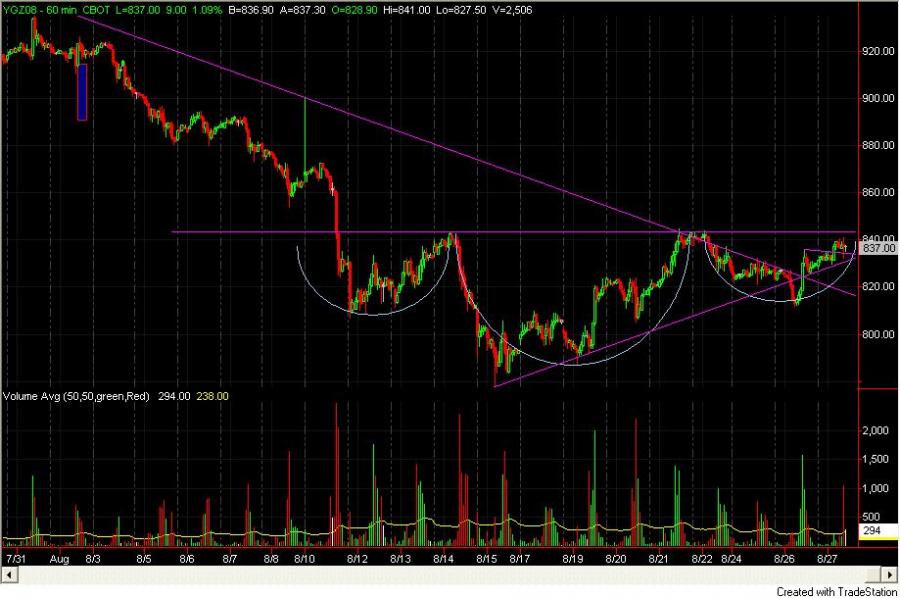
Gold December contract inverse H&S continues to look good but still needs to break above the Neckline around $845
 As usual don't get all bull'd or bear'd up. things can change quickly!
 As usual don't get all bull'd or bear'd up. things can change quickly!
#5
skott
-
- Traders-Talk User
- 4,712 posts
Member
Posted 27 August 2008 - 09:24 AM
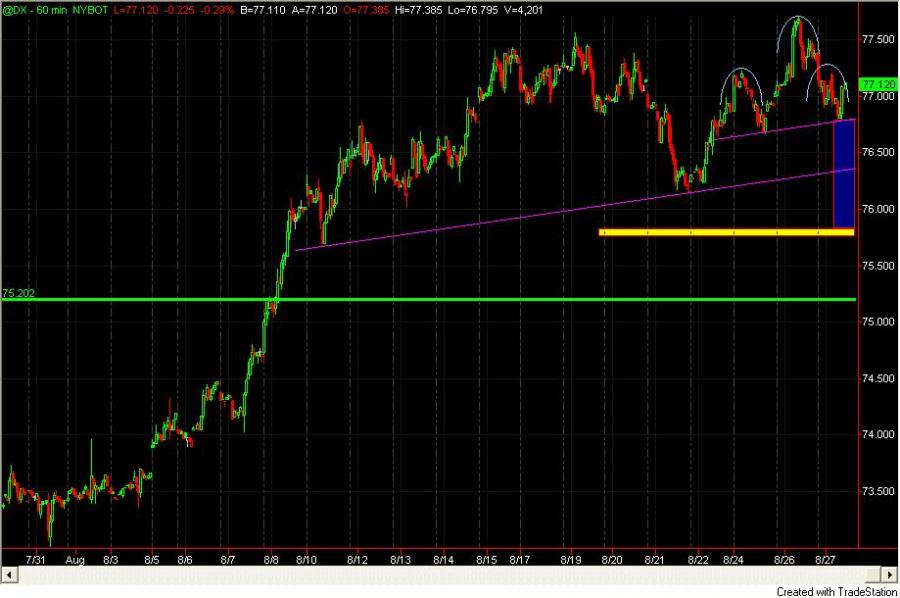
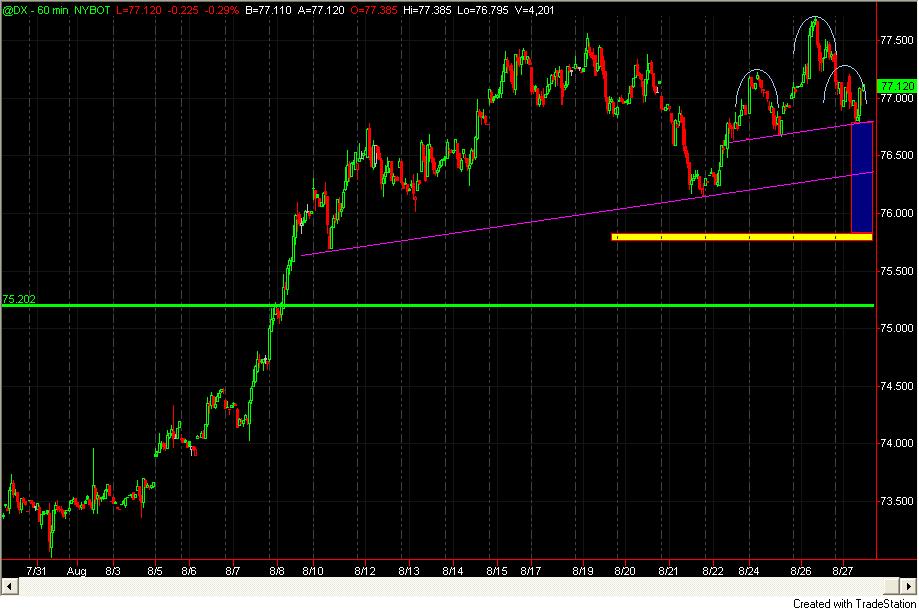
And here is the US $......... again it has not given the sell signal yet but it looks to have completed an impulse and is correcting it. I have a target at that green line(which is support) the blue rectangle gives the length of the move down that would be expected if the H&S breaks.... to the yellow area. If that happens we have broken that trendline I have drawn. Of course all this supports Gold if it happens.
#6
skott
-
- Traders-Talk User
- 4,712 posts
Member
Posted 27 August 2008 - 09:35 AM
I wonder if the oil news will take the market down?
#7
skott
-
- Traders-Talk User
- 4,712 posts
Member
Posted 27 August 2008 - 09:40 AM
Remember the 1281 resistance number I said the market might rise to. We just hit 1279.75 I am going to hold short at least one more day. BUT that's me and I have a large cushion from August 11 levels. The market may turn down here for the day but still end positive and then go down tomorrow. Hopefully a sharp down day
#8
skott
-
- Traders-Talk User
- 4,712 posts
Member
Posted 27 August 2008 - 10:16 AM
interesting that the market turned down when I said "right here" I mentioned 1279.75 and that is the high so far....... to me it says traders are honoring that 1281 resistance and want to sell ahead of it. 1274 was/is support and the bounce there was expected. Now watch and see which way it goes........that's all you can do. I said 1281 is a short with a tight stop
#9
skott
-
- Traders-Talk User
- 4,712 posts
Member
Posted 27 August 2008 - 12:24 PM
I'm still short. been away for a couple hours
#10
skott
-
- Traders-Talk User
- 4,712 posts
Member
Posted 27 August 2008 - 01:05 PM
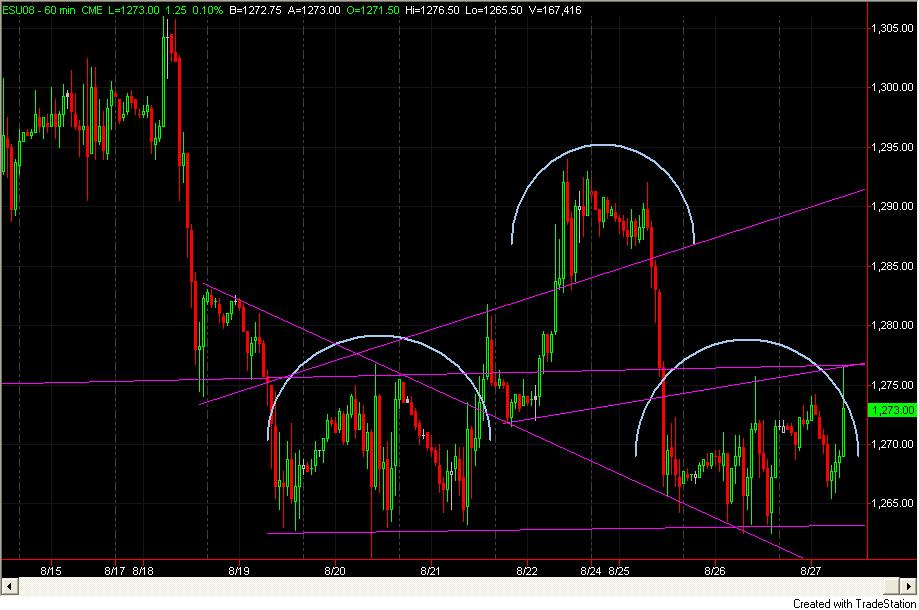
An update on the H&S on the E mini. Isn't this cute?