Edited by skott, 28 October 2008 - 12:46 PM.

Member
Posted 28 October 2008 - 12:41 PM
Edited by skott, 28 October 2008 - 12:46 PM.
Member

Posted 28 October 2008 - 01:06 PM
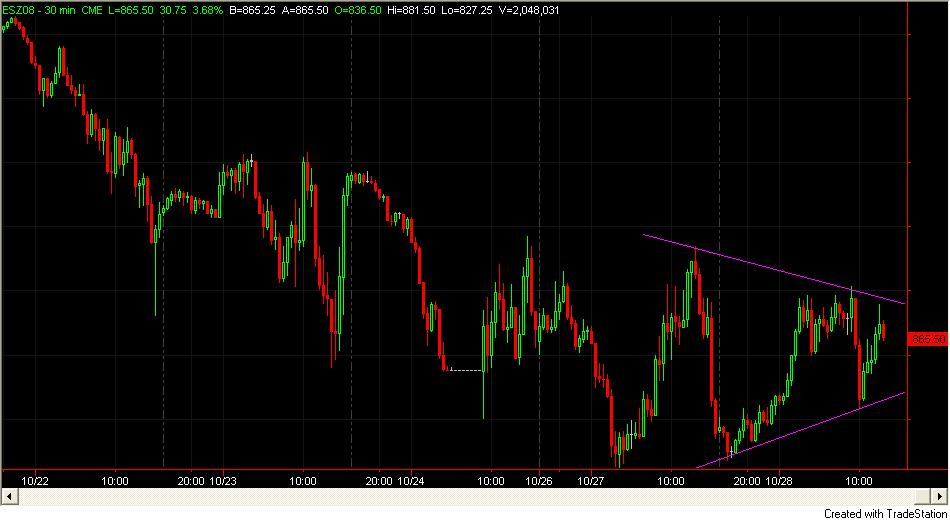
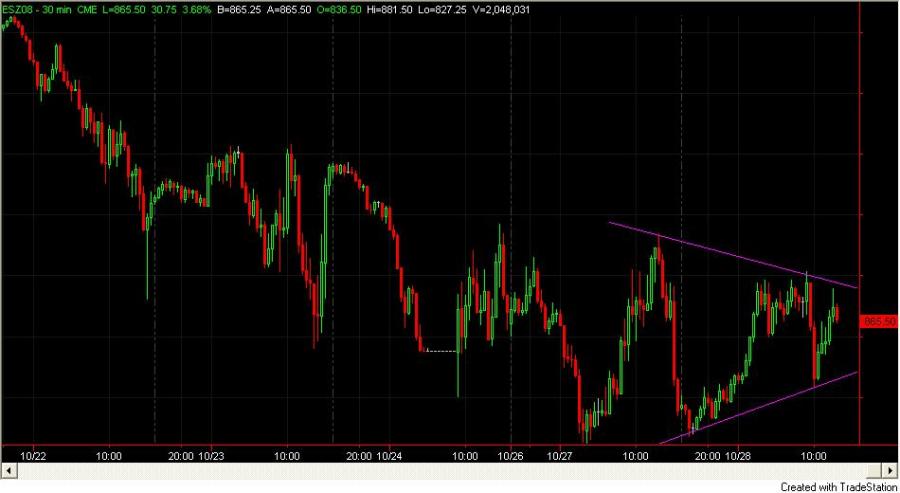
This is an intraday pattern but we are also in a larger triangle pattern since Oct 10 lows. No prediction just saying the pattern is there and wave e is complete. Need to break 845 to imply any real downside for today/tomorrow
Member
Posted 28 October 2008 - 01:30 PM
Member
Posted 28 October 2008 - 02:04 PM


