
Pitchfork Intersections Nail S&P 500 Low
Started by
kssmibotm
, Oct 29 2008 06:50 PM
3 replies to this topic
#1

kssmibotm
-
- Traders-Talk User
- 654 posts
Member
Posted 29 October 2008 - 06:50 PM
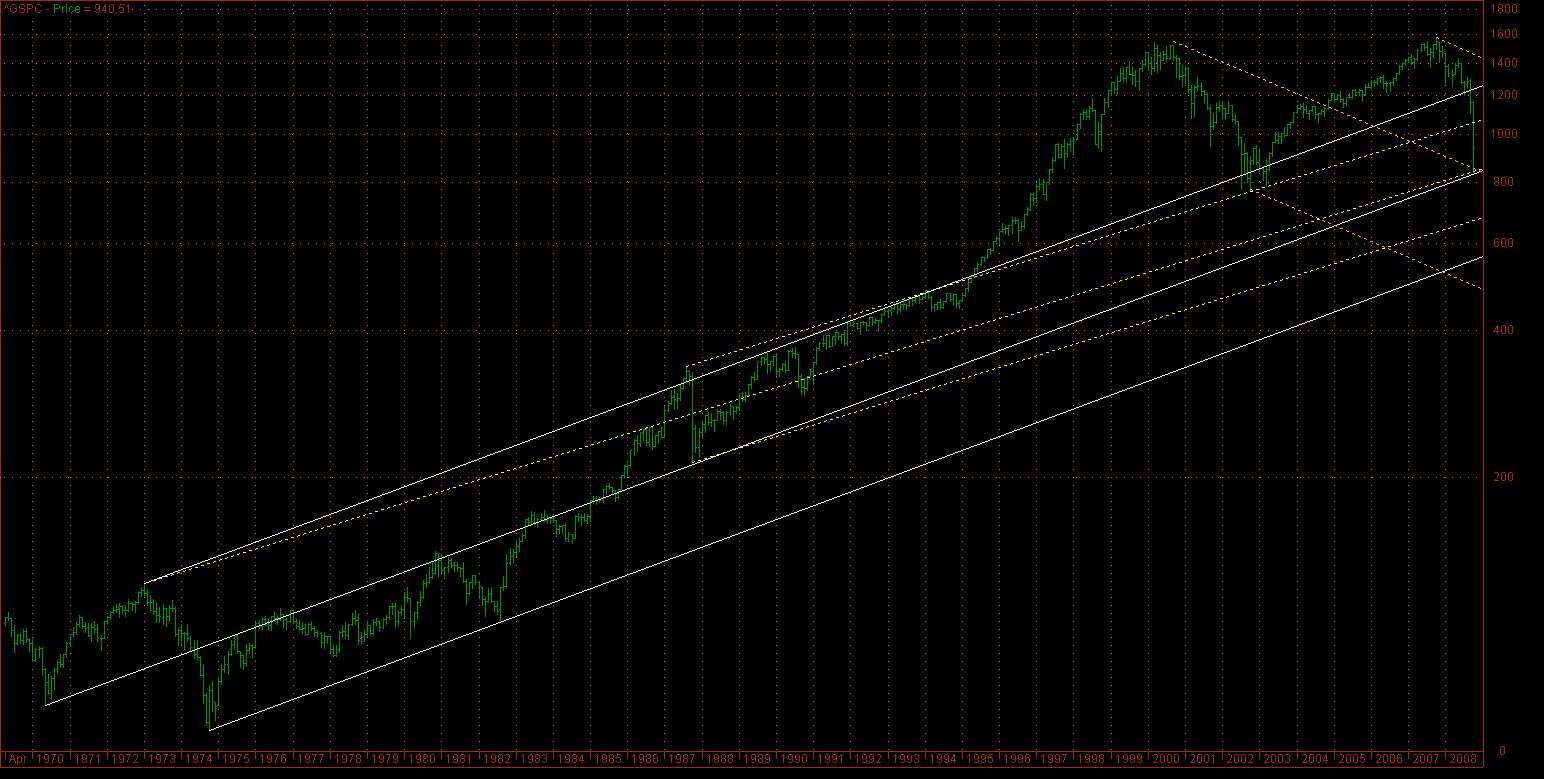
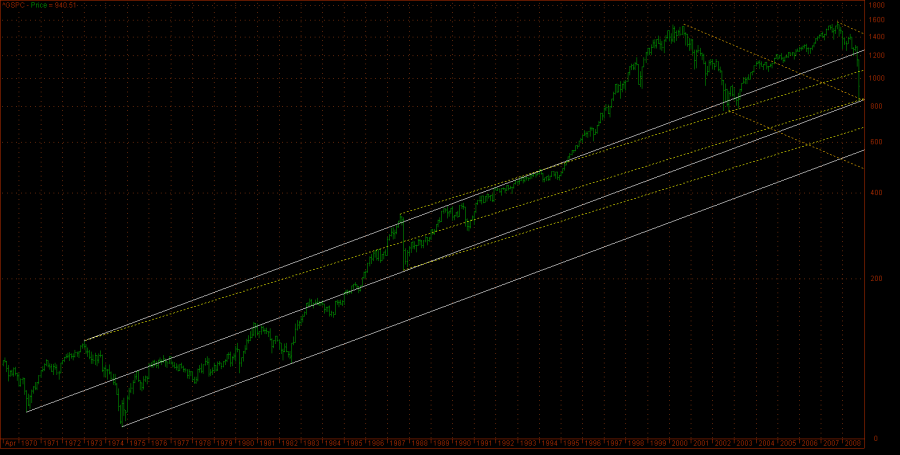
In the chart below, I have drawn 3 pitchforks from key high/low points in the SPX. All three intersect at the October 10th low at 840 +/- 10. The first fork (solid white lines) originates from the 1970 low, 1973 high and 1974 low. The second fork (yellow dashed lines) originates from the 1973 high, 1987 high and 1987 low. The third fork (orange dashed lines) originates from the September 2000 high, October 2002 low and October 2008 high.
As I am no pitchfork expert, I'm not sure if this is significant. Just throwing this out for comments.
People think the Holy Grail is something looked for but never found. In fact, it is something often found but rarely recognized.
#2
kssmibotm
-
- Traders-Talk User
- 654 posts
Member
Posted 29 October 2008 - 07:24 PM
Correction: In the text above, I meant to say October 2007 high rather than 2008.
People think the Holy Grail is something looked for but never found. In fact, it is something often found but rarely recognized.
#3
humble1
-

- Traders-Talk User
- 5,959 posts
Member
Posted 30 October 2008 - 01:30 AM
TERRIFIC CHART!
i am a big fan of the andrews pitchfork patterns. they hit rarely like this but when they do they tie together Time and Price in a way only the pitchfork can represent.
enveloping the 1970 low, 1973 high and 1974 low in that way (plus the other forks) is magnificent. it helps me understand how truly historic and powerful the lows of 10/10/08-10/28/08 are/were.
Edited by humble1, 30 October 2008 - 01:31 AM.
#4
kssmibotm
-
- Traders-Talk User
- 654 posts
Member
Posted 30 October 2008 - 08:22 PM
TERRIFIC CHART!
i am a big fan of the andrews pitchfork patterns. they hit rarely like this but when they do they tie together Time and Price in a way only the pitchfork can represent.
enveloping the 1970 low, 1973 high and 1974 low in that way (plus the other forks) is magnificent. it helps me understand how truly historic and powerful the lows of 10/10/08-10/28/08 are/were.
Thanks H1. It may be premature to call 10/10/08 an historic low. Most of the e-wave counts have it as a wave 3 low. Time will tell.
I am only familiar with using andrews pitchforks for identifying channel support and resistance. I've never seen it applied to identify lows or highs via an intersection of mutliple pitchforks. If you have encountered a similar application that nailed a major low or high, please share it.
kmb
People think the Holy Grail is something looked for but never found. In fact, it is something often found but rarely recognized.


