
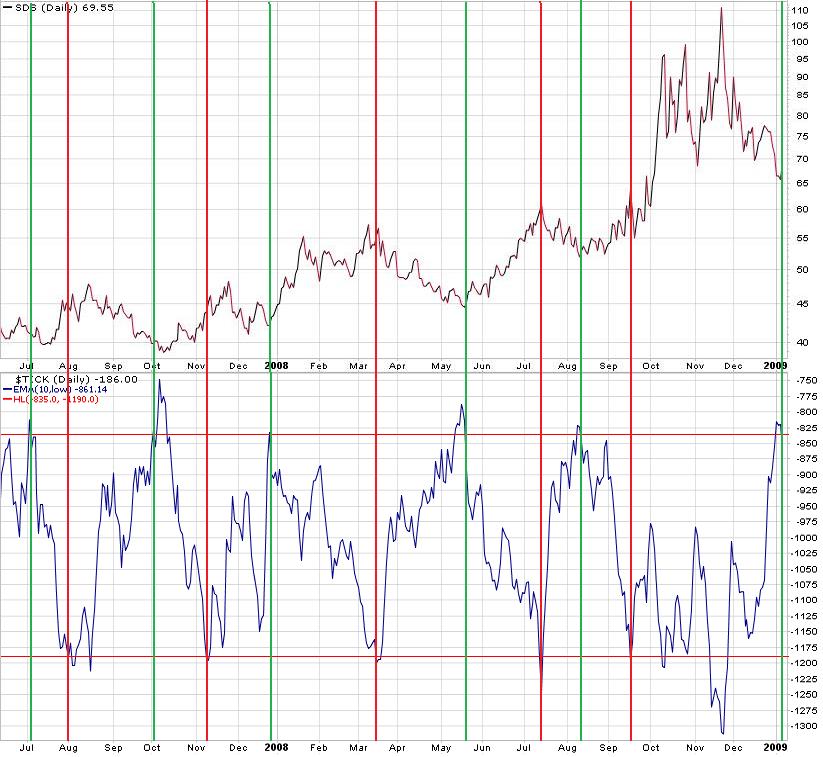
This signal has worked well since the bear market began
Started by
Apollo
, Jan 07 2009 08:35 PM
6 replies to this topic
#1

Apollo
-
- Traders-Talk User
- 146 posts
Member
Posted 07 January 2009 - 08:35 PM
Buy SDS when the 10 EMA falls below -835. Sell it when it falls below -1190.
Apollo
#2
pedro
-

- Traders-Talk User
- 767 posts
Member
Posted 07 January 2009 - 09:15 PM
This looks interesting. Misses the 55 to 110 move, but maybe with a tweak.
Question though. Stockcharts gives me your -186 for today. But 10ema is 570. How do you get 861?
Something to do with the "low" in the EMA spec?
[Edit:] Yes, apparently so. What does the "low" mean in the formulation of the EMAs here? TIA
Edited by pedro, 07 January 2009 - 09:21 PM.
#3
VolPivots
-

- Chartist
- 3,203 posts
Member
Posted 07 January 2009 - 09:31 PM
Nice find!
A coupla others for the TA arsensal
This one's more for position traders
http://stockcharts.com/c-sc/sc?s=$VXV:$VIX&p=D&yr=0&mn=11&dy=0&i=p71468288904&a=136724537&r=7500.png
And one for ST traders
http://stockcharts.com/c-sc/sc?s=$BXM&p=D&yr=0&mn=3&dy=0&i=p16762178655&a=136724542&r=737.png
A coupla others for the TA arsensal
This one's more for position traders
http://stockcharts.com/c-sc/sc?s=$VXV:$VIX&p=D&yr=0&mn=11&dy=0&i=p71468288904&a=136724537&r=7500.png
And one for ST traders
http://stockcharts.com/c-sc/sc?s=$BXM&p=D&yr=0&mn=3&dy=0&i=p16762178655&a=136724542&r=737.png
#4
thespookyone
-

- Traders-Talk User
- 6,043 posts
Member
Posted 07 January 2009 - 09:41 PM
Apollo-Nice work! What a great site we have here, lots of unique and inventive takes.
#5
Apollo
-
- Traders-Talk User
- 146 posts
Member
Posted 07 January 2009 - 09:50 PM
This looks interesting. Misses the 55 to 110 move, but maybe with a tweak.
Question though. Stockcharts gives me your -186 for today. But 10ema is 570. How do you get 861?
Something to do with the "low" in the EMA spec?
[Edit:] Yes, apparently so. What does the "low" mean in the formulation of the EMAs here? TIA
In the parameters box behind "Exp Mov. Avg" put "10,l". l = low. You can also use an h for high.
#6
vitaminm
-

- Traders-Talk User
- 6,701 posts
Member
Posted 08 January 2009 - 01:19 AM
sds...behind
http://stockcharts.com/h-sc/ui?s=$TIC...id=p52219481575
http://stockcharts.com/h-sc/ui?s=$TIC...id=p14374902957
http://stockcharts.com/h-sc/ui?s=$TIC...id=p52219481575
http://stockcharts.com/h-sc/ui?s=$TIC...id=p14374902957
Buy SDS when the 10 EMA falls below -835. Sell it when it falls below -1190.
Apollo
Edited by vitaminm, 08 January 2009 - 01:21 AM.
vitaminm
#7
pedro
-
- Traders-Talk User
- 767 posts
Member
Posted 08 January 2009 - 08:31 AM
What does the "low" mean in the formulation of the EMAs here? TIA[/quote]
In the parameters box behind "Exp Mov. Avg" put "10,l". l = low. You can also use an h for high.
[/quote]
Yeah, eventually it occurred to me that you can choose between OHLC this way.
BUT ... isn't the closing TICK always just one number? Like mutual funds where OHLC are all the same?
BUT THEN ... it should be that ema 10 = ema 10,L (or O, H) ... but they aren't.
Hmmm. Still puzzled.
Nevertheless, nice find indeed.


