

xau daily
Started by
gvc
, Jan 22 2009 04:44 PM
20 replies to this topic
#1

gvc
-
- Traders-Talk User
- 409 posts
Member
Posted 22 January 2009 - 04:44 PM
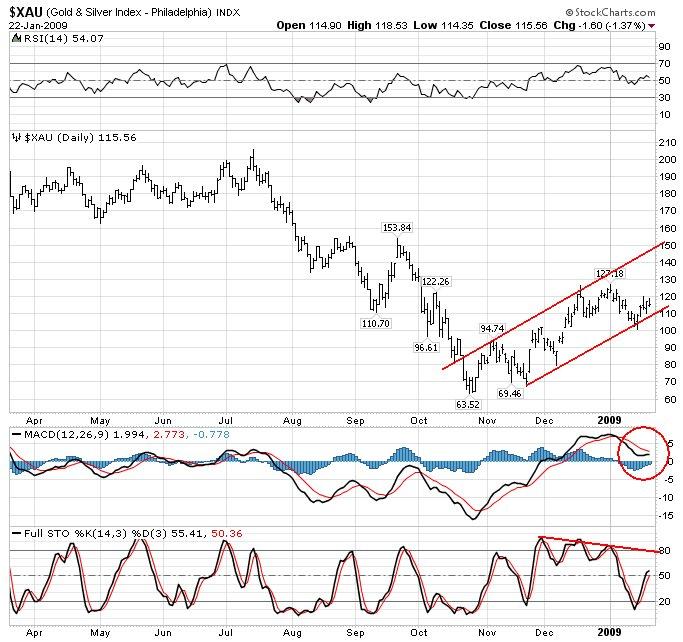
One last push towards the upper boundary of the trend channel:
#2
senorBS
-

- TT Member+
- 10,964 posts
Member
Posted 22 January 2009 - 04:47 PM
One last push towards the upper boundary of the trend channel:
Si, and that would finish maybe at 140 a bueno cinco wave rally from October low and be muy bullish long term. But remember prices would then need to correct the entire rally.
NO BS
Senor
#3
dharma
-

- Traders-Talk User
- 9,621 posts
Member
Posted 23 January 2009 - 10:46 AM
yes, i am looking alittle higher, but the correction will be a big % . dharmaOne last push towards the upper boundary of the trend channel:
Si, and that would finish maybe at 140 a bueno cinco wave rally from October low and be muy bullish long term. But remember prices would then need to correct the entire rally.
NO BS
Senor
#4
gvc
-
- Traders-Talk User
- 409 posts
Member
Posted 23 January 2009 - 11:26 AM
1.618 x the first rally leg from 63.52 to 94.74 = 50.51 which, added to the recent low of 100.74 = 151.25
#5
Woody
-

- Traders-Talk User
- 1,498 posts
Member
Posted 23 January 2009 - 12:24 PM
My thinking as well although I'm not an EWaver, but if we get Sentiment & EWavers in agreement then increases odds of being correct.
Watch the $XAU versus $GOLD and $SPX to get a hint on a turn.
#6
tradesurfer
-

- Traders-Talk User
- 2,944 posts
Member
Posted 23 January 2009 - 01:59 PM
i dont understand why senor and darma are looking for a such a huge correction when and if the XAU gets to 150?
do you guys see the very large head and shoulders bottom formation that the S&P global gold index just broke out of ?
http://stockcharts.com/h-sc/ui?s=$SPT...id=p09099055654
why cant we have the big correction after we break the neckline?
I am just trying to think how this correction would fit within the context of these large head and shoulder bottom patterns and cup and handle bottoming patterns.
for example on the GDX it looks like we are getting a breakout out of a large cup and handle pattern.... a 'big' correction just does not seem in the cards based on the target price implications of that pattern and the nature of cup and handles...
could we correct to the 34 level on the GDX after we move to the 40 level? yes of course... but anything large than that would maybe invalidate the cup and handle..do you see what i am getting at??
#7
dharma
-
- Traders-Talk User
- 9,621 posts
Member
Posted 23 January 2009 - 02:23 PM
i do not think this wave is finished. and your target is within my target of 150-155. when this wave finishes, it will be a wave 1 and wave 2s correct .618 of wave 1 it can be a bigger % as well. its just the nature of the beast. but then 3 should be impressive. although in commodities wave 5s are the big %gainers dharmai dont understand why senor and darma are looking for a such a huge correction when and if the XAU gets to 150?
do you guys see the very large head and shoulders bottom formation that the S&P global gold index just broke out of ?
http://stockcharts.com/h-sc/ui?s=$SPT...id=p09099055654
why cant we have the big correction after we break the neckline?
I am just trying to think how this correction would fit within the context of these large head and shoulder bottom patterns and cup and handle bottoming patterns.
for example on the GDX it looks like we are getting a breakout out of a large cup and handle pattern.... a 'big' correction just does not seem in the cards based on the target price implications of that pattern and the nature of cup and handles...
could we correct to the 34 level on the GDX after we move to the 40 level? yes of course... but anything large than that would maybe invalidate the cup and handle..do you see what i am getting at??
#8
gvc
-
- Traders-Talk User
- 409 posts
Member
Posted 23 January 2009 - 03:04 PM
also lots of gaps down there to fill on the xau, the lowest one would be 74.79 on 11/20/08.....but that one may stay unfilled. there's also one at 87.58 from 12/05/08 and 98.87 from 12/09/08
#9
senorBS
-
- TT Member+
- 10,964 posts
Member
Posted 23 January 2009 - 03:23 PM
i do not think this wave is finished. and your target is within my target of 150-155. when this wave finishes, it will be a wave 1 and wave 2s correct .618 of wave 1 it can be a bigger % as well. its just the nature of the beast. but then 3 should be impressive. although in commodities wave 5s are the big %gainers dharmai dont understand why senor and darma are looking for a such a huge correction when and if the XAU gets to 150?
do you guys see the very large head and shoulders bottom formation that the S&P global gold index just broke out of ?
http://stockcharts.com/h-sc/ui?s=$SPT...id=p09099055654
why cant we have the big correction after we break the neckline?
I am just trying to think how this correction would fit within the context of these large head and shoulder bottom patterns and cup and handle bottoming patterns.
for example on the GDX it looks like we are getting a breakout out of a large cup and handle pattern.... a 'big' correction just does not seem in the cards based on the target price implications of that pattern and the nature of cup and handles...
could we correct to the 34 level on the GDX after we move to the 40 level? yes of course... but anything large than that would maybe invalidate the cup and handle..do you see what i am getting at??
Exactly Dharma, what MUY BUENO trading this portends eh amigo?
NO BS
Senor
#10
dharma
-
- Traders-Talk User
- 9,621 posts
Member
Posted 23 January 2009 - 03:48 PM
yes, i am now watching the triple top, triple tops almost never hold., @930ish on gold. take that out and its game on. there is a fundamental shift in gold. bonds appear to have put in some kind of top. and gold continues up w/the dollar.its in its role as currency. @this top i want to be alert. also i thought the correction after this top would be somewhat lengthy. till sept. i am going to take my model and throw it out the window and stay w/the market here. wave 2 will provide another great buying opportunity. dharmai do not think this wave is finished. and your target is within my target of 150-155. when this wave finishes, it will be a wave 1 and wave 2s correct .618 of wave 1 it can be a bigger % as well. its just the nature of the beast. but then 3 should be impressive. although in commodities wave 5s are the big %gainers dharmai dont understand why senor and darma are looking for a such a huge correction when and if the XAU gets to 150?
do you guys see the very large head and shoulders bottom formation that the S&P global gold index just broke out of ?
http://stockcharts.com/h-sc/ui?s=$SPT...id=p09099055654
why cant we have the big correction after we break the neckline?
I am just trying to think how this correction would fit within the context of these large head and shoulder bottom patterns and cup and handle bottoming patterns.
for example on the GDX it looks like we are getting a breakout out of a large cup and handle pattern.... a 'big' correction just does not seem in the cards based on the target price implications of that pattern and the nature of cup and handles...
could we correct to the 34 level on the GDX after we move to the 40 level? yes of course... but anything large than that would maybe invalidate the cup and handle..do you see what i am getting at??
Exactly Dharma, what MUY BUENO trading this portends eh amigo?
NO BS
Senor
ps. one of the things i appreciate about senor is he does his own work!


