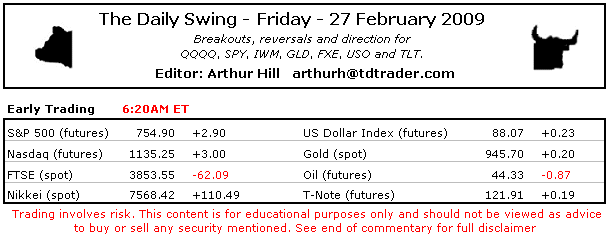
***Executive Summary***
- Stock Market Stance Remains Neutral
- QQQQ Breaks Back below 28
- IWM Breaks Monday's Low
- SPY Extends Inside Days
- UUP Benefits as Safe-Haven and Reserve
- GLD Hits First Support Zone
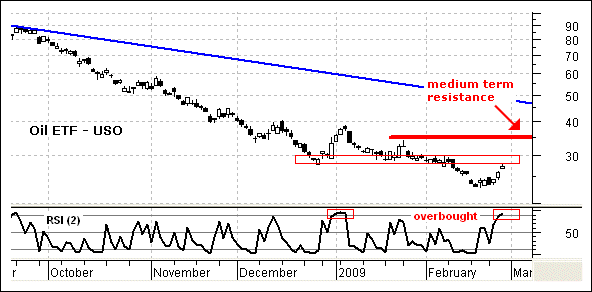
- USO Becomes Short-term Overbought
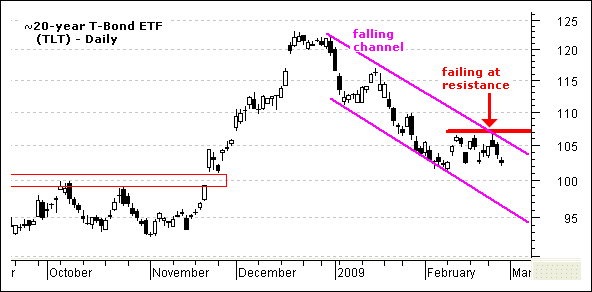
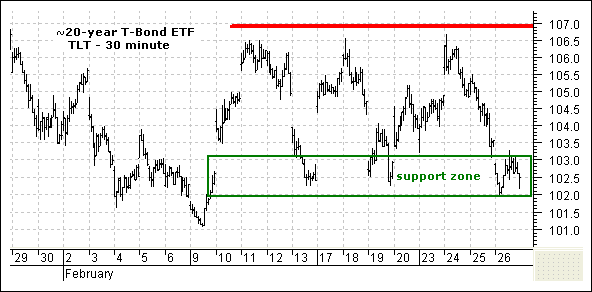
- TLT Trades Down to Range Support
- Video Includes XRT and Retail Stocks
- AEO, ANF, ARO, BBBY, CONN, GES, IDC, KSS, VIA.B(video link)
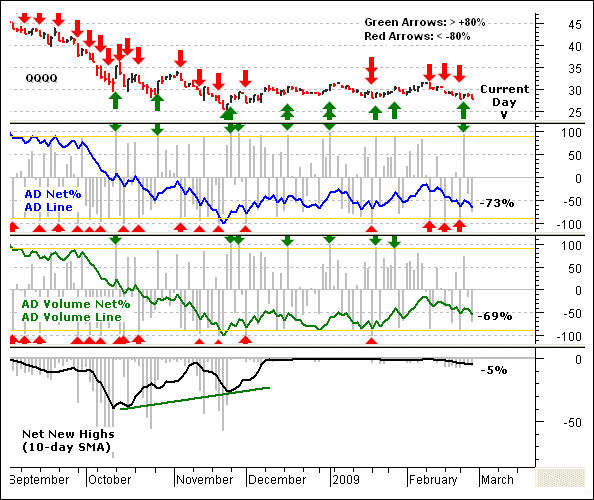
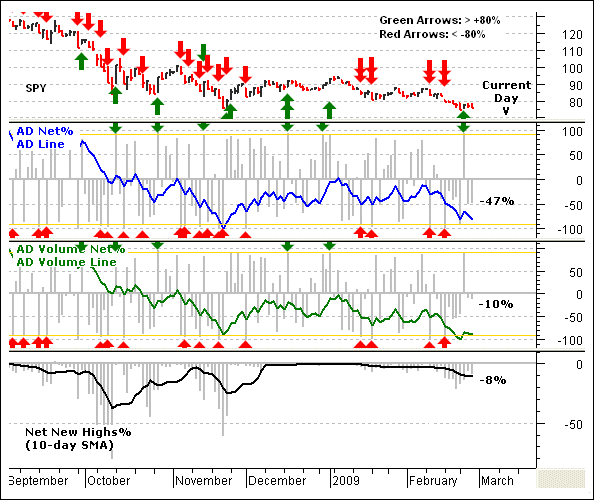
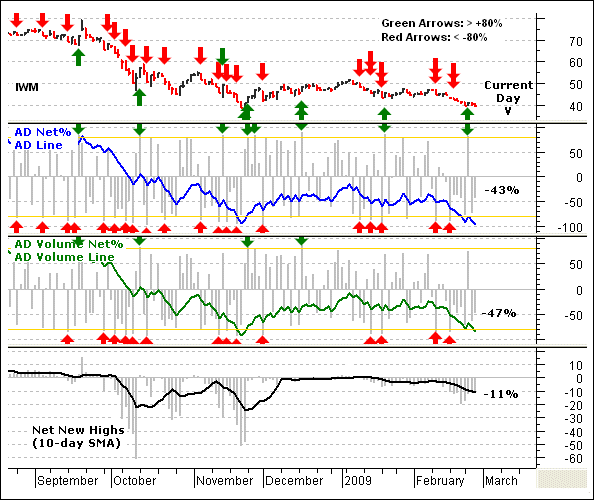
Medium-term Recap: The bulk of the medium-term evidence still favors the bears. First, the S&P 1500 forged double negative breadth extremes on 14-Jan, 20-Jan, 10-Feb and 17-Feb. A double negative breadth extreme occurs when both AD Net% and AD Volume Net% exceed –90%. Second, volume on up days has not been impressive. Third, the decline started in early January and we have yet to see a high volume capitulation or selling climax. Most bottoms form after some sort of capitulation or selling climax. Fourth, the Put/Call Ratios have yet to reach extremes that signal a medium-term bottom.
Market moving events for the next few trading days:
- Friday: GDP, Consumer Sentiment, NAPM Chicago
-Earnings: Aircastle, Interpublic, Mirant, Integra - Monday: ISM Mfg Index
-Earnings: Tower Group, Ferro, Kenneth Cole, TiVo - Tuesday: Pending Home Sales, ISM Index
-Earnings: Autozone, Chicos, Tech Data, Virgin Mobile - Wednesday: Durable Goods, Crude Inventories, New Home Sales
-Earnings: Costco, Big Lots, Toll Bros, PetsMart - Thursday: Factory Orders, Jobless Claims
-Earnings: K-Swiss, MGM Mirage, Six Flags, Urban Outfitters - Friday: Employment Report
-Earnings: HR Block, Tasty Baking
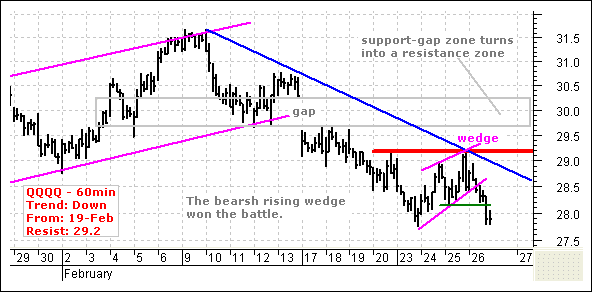
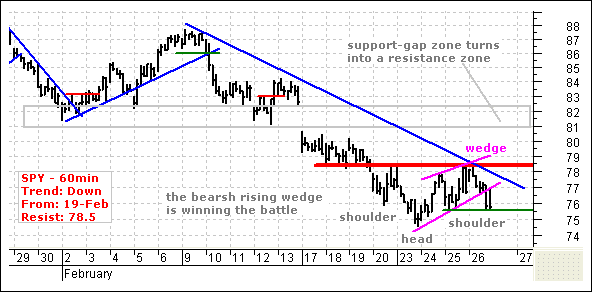
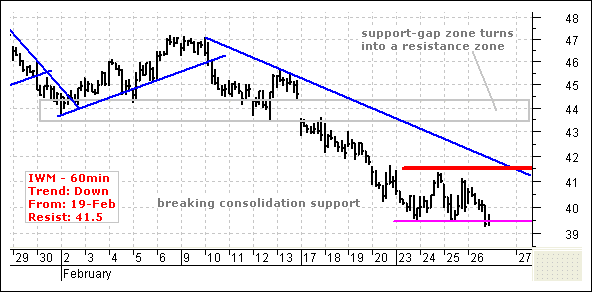
***Medium-term Trend*** QQQQ, SPY and IWM attempted to rally, but failed to hold their gains and closed sharply lower. All three formed long black candlesticks on Thursday. IWM and QQQQ broke below Monday's low to lead the way lower. SPY managed to hold above Monday's low because of relative strength in the financial sector.
Medium-term, QQQQ broke down with a gap, trendline break and lower low over the last two weeks. Even though it firmed on Tuesday-Wednesday, the technical damage remains and I expect a test of the November low. IWM and SPY also gapped down two weeks ago and broke below their January lows. These two remain in clear downtrends. SPY is firming near the November low with three inside days (Tue-Thur). So far, this looks like a consolidation within a downtrend and a continuation lower is expected. IWM consolidated on Tue-Wed, but moved to a new low for the week on Thursday. A test, or even break, of the November low is expected.
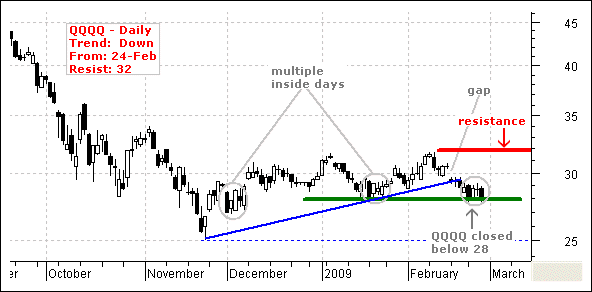
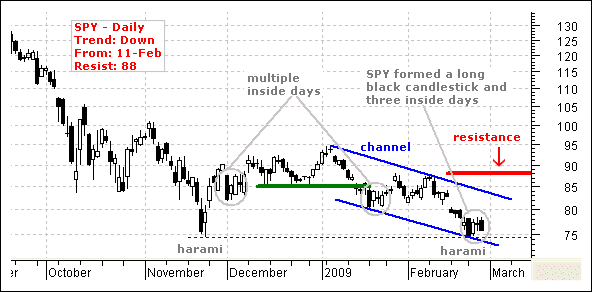
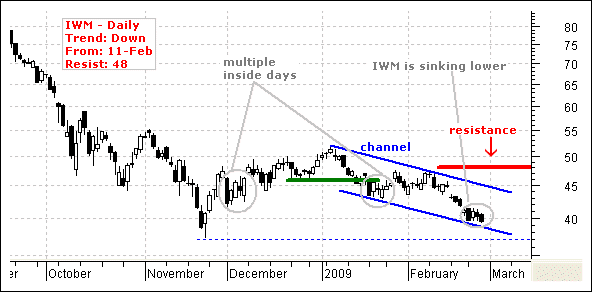
What would warrant a reassessment of my bearish prognosis? After long black candlesticks on Monday, QQQQ, SPY and IWM have essentially consolidated the last three days. Yesterday's failed rally attempt reinforced resistance from this week's high. A recovery AND close above this week's high would show strength and warrant a reassessment, especially if a long white candlestick forms. Let's see it happen first.
***Short-term Trend*** QQQQ and SPY broke rising wedge supports to signal a continuation lower. This rising wedge rally barely lasted two days before sellers reappeared. The wedge breaks open the door to new lows and reinforce resistance from this week's highs. SPY still has a potential head-and-shoulders working, but QQQQ does not as it declined to Monday's low. IWM broke Monday's low and remains the weakest.
***Inter-Market Charts***
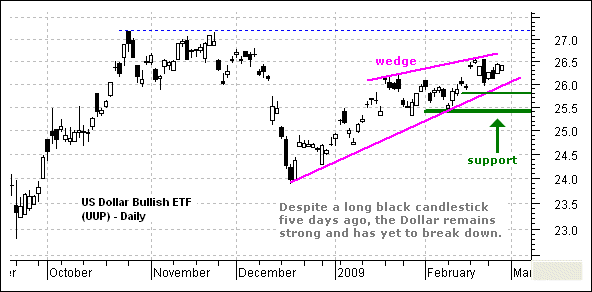
***Dollar*** The US Dollar Index Bullish ETF (UUP) continues to benefit from its status as a safe-haven currency and a reserve currency. The Yen and Swiss Franc were the prior safe-haven currencies. With the Japanese economy in another tailspin and the Yen carry trade unwinding, investors are not buying Yen. The Swiss Franc has lost its luster as a safe-haven because of the financial crisis. After all, Switzerland is known for its banks and we are in the middle of a banking crisis.
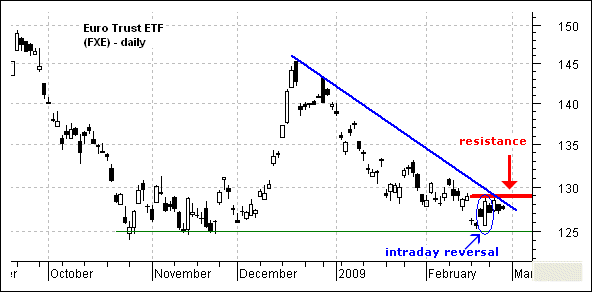
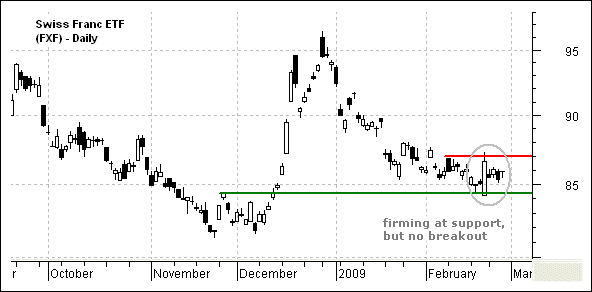
On the price chart, the US Dollar Index Bullish ETF continues to advance within a rising wedge. While this pattern may be potentially bearish, it is currently bullish because it is still rising. Only a break below the lower trendline and last week's low would warrant a reassessment. The Euro Trust ETF (FXE) is testing support from its Oct-Nov lows. The ETF reversed last Friday, but there was NO follow through. With a tight range over the last four days, a break above 129 would be quite bullish. I will stay bearish until there is a breakout. The Swiss Franc ETF (FXF) is finding support from broken resistance around 84. The ETF also surged last Friday and then consolidated the last four days. Look for a break above 87 to reverse the decline. Even though Switzerland is not part of the EU, its currency tracks the Euro quite well.
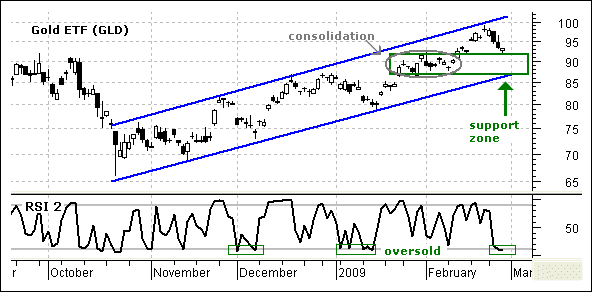
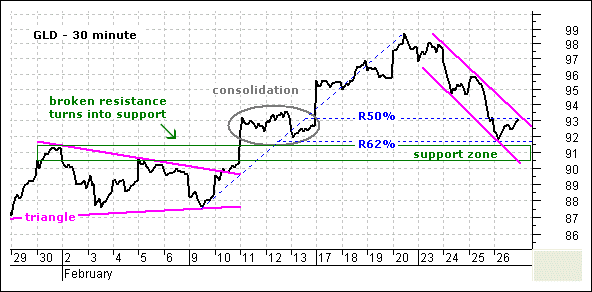
***Gold*** The SPDR Gold ETF (GLD) remains in a clear uptrend and is currently testing the upper boundary of its support zone. The sharp pullback over the last four days alleviated overbought conditions as RSI(2) dipped below 10 for the first time since early January. This is not a buy signal, but rather an alert to be on guard for a short-term reversal on the 30-minute chart. After a surge from 87.5 to 98.5 (9-20 Feb), GLD retraced 50-62% with a falling flag. The ETF got a small bounce off the 62% retracement mark yesterday and this is the first place to anticipate a reversal. Anticipation is tricky and this is a short-term trade that will require a close watch. A move above 93.5 would break the flag trendline and act as a short-term bullish signal.
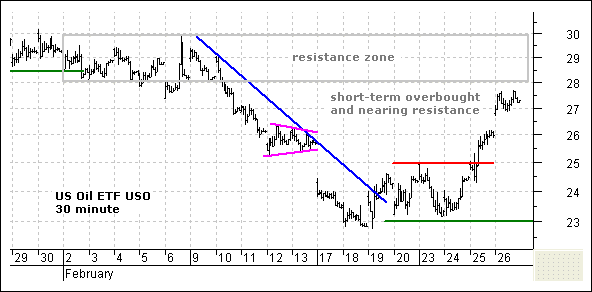
***Oil*** While gold became short-term oversold, the United States Oil Fund ETF (USO) became short-term overbought. USO surged to 27.63 on the high yesterday and this is just shy of the resistance zone around 28-30. With this surge, RSI(2) moved above 90 for the first time since early January. The early January move above 90 lasted for four days. While there is no telling how long a short-term overbought condition will last, further upside in oil looks limited at this stage. On the 30-minute chart, USO is up almost 20% in the last few days. The ETF gapped up and stalled around 27-27.5 yesterday. This gap is positive as long as it holds. A move into the gap zone would show weakness and could end the current bounce.
***Bonds*** No change. Fundamentally, there is clearly downside pressure on bonds. The bailouts and stimulus plans need to be financed and this will create new supply in the coming quarters. On the demand side, the corporate bond market is improving and this creates more competition to treasuries. Japan moved from a budget surplus to a budget deficit. Foreign governments and companies buy treasures to keep their cash in safe place. With budget surpluses disappearing and corporate profits under pressure, there will be less free cash available for US treasuries. It all adds up to downward pressure on the US Treasury Bonds. There is sometimes a lag between the fundamentals and the technicals, but the iShares 20+Yr T-Bond ETF (TLT) is looking ripe for further weakness. TLT failed to break above 107 and declined from key resistance over the last three days. The trading range over the last two weeks looks like a consolidation within downtrend. A continuation of this downtrend would project further weakness towards the 95-97 area. One caveat still applies: a sharp decline in stocks could provide a safe-haven lift for bonds.
Good day and good trading -Arthur Hill
---------------------------------------------------------------
Click here to post a comment, suggestion or question.
Breadth Charts ---------------------------------
---------------------------------------------------------------
Disclaimer: Arthur Hill is not a registered investment advisor. The analysis presented is not a solicitation to buy, avoid, sell or sell short any security. Anyone using this analysis does so at his or her own risk. Arthur Hill and TD Trader assume no liability for the use of this analysis. There is no guarantee that the facts are accurate or that the analysis presented will be correct. Past performance does not guarantee future performance. Arthur Hill may have positions in the securities analyzed and these may have been taken before or after the analysis was present.
--------------------------------------------------------
about: The Daily Swing is posted every trading day around 6AM ET and focuses on short-term strategies for QQQQ, SPY and IWM. In addition, at two stock setups are featured every day with a detailed trading strategy. As warranted, coverage extends to broad market topics, key sectors and industry groups and inter-market securities (gold, bonds, the Dollar and oil).
--------------------------------------------------------
Sources: Data from Bloomberg.com, CBOT.com, Kitco.com and ino.com; Charting from Metastock (equis.com). Closing data from Reuters.com, eSignal.com, MS QuoteCenter and Yahoo! Finance.


