Awesome
be sure to keep an eye on http://spaceweather.com/ for latest sunspots (aka chances of solar storms)
sun is waking up and we're in for a nice ride
thanks for sharing! love it

ASTRO FOR NEXT WEEK
Started by
Stickan
, Jun 09 2010 07:11 PM
21 replies to this topic
#11

InvestingFreak
-

- Traders-Talk User
- 50 posts
Member
#12
JimBecker17
-

- Traders-Talk User
- 160 posts
Member
Posted 10 June 2010 - 10:51 AM
someone might have posted this but here are links of what has started. i'd note the first one was right around the topping process. they quote a guy who says 45 years hasn't seen anything like this.
http://science.nasa....r10_plasmarain/
http://science.nasa....010/04jun_swef/
http://science.nasa....r10_plasmarain/
http://science.nasa....010/04jun_swef/
Bullish Equity service: WM Research, LLC using IBD / Wyckoff principles realtime.
#13
InvestingFreak
-
- Traders-Talk User
- 50 posts
Member
Posted 10 June 2010 - 10:55 AM
yep. 27th i saw and got short the 28th. boy did that prove to be one delicious decision  thanks for sharing the links again.
thanks for sharing the links again.
"I hate weekends because there is no stock market." -Investing Freak
#14
darnelds
-

- Traders-Talk User
- 484 posts
Member
Posted 11 June 2010 - 03:26 PM
Arch was a loser last year.
http://seekingalpha....-10-newsletters
http://seekingalpha....-10-newsletters
Arch has been talking about the summer of 2010 for a long time. Here's the Seeking Alpha interview.
#15
apprentice
-

- Traders-Talk User
- 42 posts
Member
Posted 11 June 2010 - 05:29 PM
Dear Stickan,
Thank you so much for your post which was, as usual both thorough and excellent.
My question is this: During the period you mention, June 24-27, or thereabouts, if the market is in retracement mode, at what level would you consider the S and P, for example, to be in an uptrend, and this likely to crash up.
Again, thank you for your excellent analysis and your answer, if at all possible, to my question.
Sincerely yours,
SHP
I originally thought about translating my Danish market letter fram last wekend, but I am short of time, so instead let's look at some unusual stuff.
It's a little embarassing to projet the same thing as others do, a crash, but hopefully this post gives clues that we have not yet covered.
Astro.
Let's start with "lagrange points" - in the picture below they are marked L4 and L5.
These points are, where the sum of the gravitational pulls from two heavenly bodies are =0
If you want to place a satelite somewhere for example - this is the place.
Another way of looking at it, is that we have a concentration of energy at these points.
So what?
Well, looking at this picture we can see that the aspect between these points are 120 degrees.
It's also explained at Wikipedia.
What is interesting is that on august 24 - the top before the Crash, ALL the inner planets (including the moon) in the Solar system had formed a straight line to Earth an together with Jupiter (the second most powerful planet, when it comes to gravity) it formet 120 degrees to Galactic Center - the most powerful source of gravity/energy in our galaxy.
Not too long ago - January 2008, we had a similar constellation. The most important planets - finacial astrology wise - Saturn and Jupiter again formed the "lagrange picture" together with Venus. Mercury was the "trigger" - - it stopped the first wave down from the 2007 top preceeded by a crash like movement!
AGAIN - at the bottom of 1974 Saturn formed a "lagrange" picture to Venus with Mercury as the "trigger".
It was three weeks away from the bottom - but in the context of the start of a mega-long bullmarket, I would say that the precision is ******* enough for government work......
But if you have studied aspect combinations you know that it does not have to be 120 degrees all the time. 90 and 180 is just as powerful.
Last month we had a combination of two oppositions on May 23 (weekend) and on monday 25th we bottomed out.
What we have seen so far is forplay to the event we are waiting for to develop next week June 17 to 25.
This is the most gigantic T-square (2 oppositions 90 degrees apart), ever seen. And in my opinion a T-square of this magnitude is just as powerful as the "lagrange" aspects we have seen.
To understand the rarity of this event we must know that Jupiter has a cycle of 11.86 years, Saturn 29,5 years and Uranus 84 years .
To imagine the power released when the largest palnets in the solar system compines with the largest force in the galaxy, is difficult. This generation has not seen anything similar, just as we have not seen a crisis like the one we are in, before.
It adds up.
Compare it to 1987 when allt the INNER planets were involved with the smallest cyclical effect it created a "quick surgical" cut to the bullish chart - but the trend was intact.
What we now are witnessing , is a constellation of the planets with the longest cycklical power, releasing their energy at the same time we have a world wide crisis not seen before. My take is that we will be witnessing something similar, but in a much larger perpective.
There are only two kinds of energy in the stockmarket - positiv or negative energy.
Positive energy in a falling market is what creates bottoms and negativ energy in a rising market creates tops.
this energy is created by clusters of planetary aspects - the more asopects the more powerful is the energy.
Negative energy in a falling market creates crashes.
Positive energy create up-crashes (Feb 1995)
The most common pattern in these energy situations is that the market will be pulled into the direction taken before the aspect period, with a climax somewhere in the period.
Now- since the trend has been down - the most probable path will be DOWN - with help of the energy from the most powerfu planets in the solar system.
It does look like a crash - perhaps the the most devastating crash we have seen.
I think the clue is the Euro - it will probably go first - then the stockmarket.
And also consider Gold, in my opinion not a gauge of inflation anymore but FEAR - a spike in Gold could also be the clue.
But since all eyes are on the stockmarket - it will not give the clue.
When we look at aspects between the outer planets it is always a good thing to consider, is there a trigger around - like the moon or Mercury, to better pinpoint the date of a possible energy relase.
FRACTALS is popular, so let's look at an astrofractal.
Below we can se that june 24-27 mercury is cutting through the gigantic constallation, it's kind of a mini T-square to the big one.
My guess is therefore that we will have maximum energy release in the market in that period.
Bottom or Acceleration I don't know - but the direction "must" be down.
that is my conviction.
Come to think of it, I am contemplating translating my market letter "Technical Support" to English.
If you are intersted in details mail me at dawstur@gmail.com
I am not sure I will, unless I get descent interest, but it could be fun.
RPPVW/SHP
"It is not your duty to complete the work,
but neither may you desist from it."
--Talmud
#16
Stickan
-
- Traders-Talk User
- 411 posts
Member
Posted 12 June 2010 - 05:00 AM
My question is this: During the period you mention, June 24-27, or thereabouts, if the market is in retracement mode, at what level would you consider the S and P, for example, to be in an uptrend, and this likely to crash up.
SHP
First warning would be above 1100 and then a confirmation if we break 200MA, that could cause a dramatic upmove, since everybody is expecting a down crash and break of the large H&S pattern here - including me, but I keep my eyes open for the other possibillity also.
Beacaus of the astro situation next week I think the market is in for a BIG decision next week.
Up or Down.
Future trend will probably be established here.
#17
tradesurfer
-

- Traders-Talk User
- 2,944 posts
Member
Posted 12 June 2010 - 11:49 PM
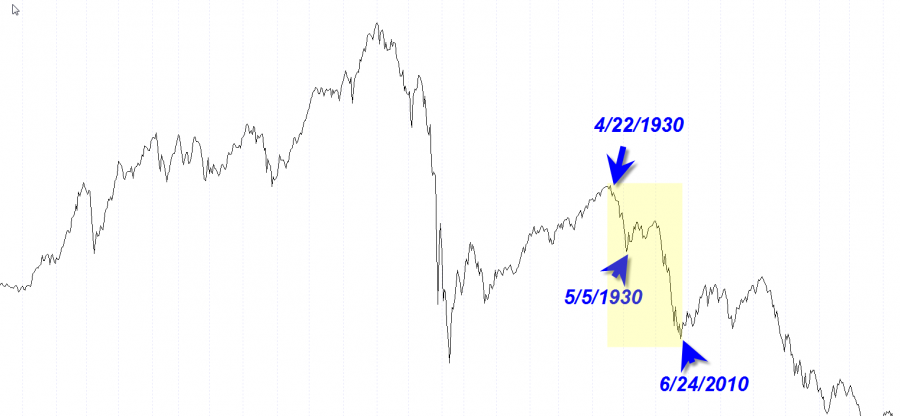
I wonder if you had a chance to look at the astro aspects for this period of 1930 after the automatic rally ended. The time frame match up to the present time frame is interesting since our decline began end of April and could drop into June 26 as you indicate.
Many comparisons have been made to the reactive peak that ended in April 1930 to our ending reactive peak in April 2010.
So I was wondering if there were similar extreme negative astro setups in June of 1930 as you see in June 2010

#18
Echo
-

- Traders-Talk User
- 2,273 posts
Member
Posted 13 June 2010 - 02:15 AM
I wonder if you had a chance to look at the astro aspects for this period of 1930 after the automatic rally ended. The time frame match up to the present time frame is interesting since our decline began end of April and could drop into June 26 as you indicate.
Many comparisons have been made to the reactive peak that ended in April 1930 to our ending reactive peak in April 2010.
So I was wondering if there were similar extreme negative astro setups in June of 1930 as you see in June 2010
TS, I see 2 nice SOB patterns in the chart. One in the shaded box and one right after.
Doc
#19
Tor
-

- Traders-Talk User
- 7,647 posts
Member
Posted 13 June 2010 - 05:24 AM
My question is this: During the period you mention, June 24-27, or thereabouts, if the market is in retracement mode, at what level would you consider the S and P, for example, to be in an uptrend, and this likely to crash up.
SHP
First warning would be above 1100 and then a confirmation if we break 200MA, that could cause a dramatic upmove, since everybody is expecting a down crash and break of the large H&S pattern here - including me, but I keep my eyes open for the other possibillity also.
Beacaus of the astro situation next week I think the market is in for a BIG decision next week.
Up or Down.
Future trend will probably be established here.
Next week is 14-20 June. Are you looking for next week to be decision week or the week after?
My work says next week is the importanto week.
Stig,
Again I love your work as yo will know.
Observer
The future is 90% present and 10% vision.
The future is 90% present and 10% vision.
#20
Tor
-
- Traders-Talk User
- 7,647 posts
Member
Posted 13 June 2010 - 05:43 AM
Stick a couple of questions if I may:
1. what is the galactic centre?
2. As I understand it you are looking for points of maximim energy, and that occurs at the larange points, when earth is beyween two planets. That is also a point of movement equilibruim, yet energy maximisation?
3. What about 120 degrees? Surely we should be looking for aliignment which is 180 degress or 90 degrees, which represents maximium conflict?
Observer
The future is 90% present and 10% vision.
The future is 90% present and 10% vision.


