

Achelis 'Extreme Point' Trade Strategy Setup
Started by
borland
, Jul 15 2010 10:14 PM
6 replies to this topic
#1

borland
-
- Traders-Talk User
- 276 posts
Member
Posted 15 July 2010 - 10:14 PM
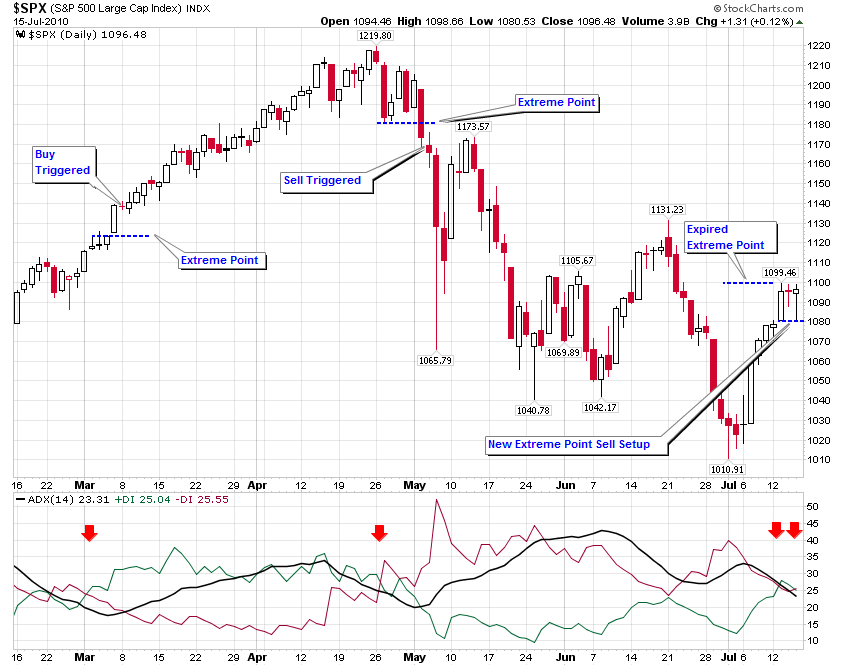
Here's another trade strategy from Maurice Walker's public charts on Stockcharts.com.
Today's DI crossover on the daily $SPX provides a setup for a possible bearish trade trigger. A close below the new extreme point would trigger a long exit or short entry.
According to Walker, "solely following the DI and -DI cross signals by themselves can lead to whipsaws and overtrading. Steven Achelis offers a solution to this problem using the 'extreme point rule' in his marvelous book, Technical Analysis From A To Z. Achelis points to the creator of the directional movement system J. Welles Wilder, and his simple trading rule, to help prevent whipsaws and reduce the number of signals that a trader acts upon. "
#2
redwraith
-

- Traders-Talk User
- 43 posts
Member
Posted 15 July 2010 - 10:39 PM
Hey Borland,
I trade by a variation of the ADX indicator and although I know nothing of the Extreme Point Trade Strategy, I must say that my ADX based system did generate a sell signal today. I guess the ramp up in the last 45 minutes of trading was a gift to get short near the highs of the day. We'll see...
#3
goldswinger
-

- Traders-Talk User
- 2,612 posts
Member
Posted 15 July 2010 - 11:38 PM
Hey Borland,
I trade by a variation of the ADX indicator and although I know nothing of the Extreme Point Trade Strategy, I must say that my ADX based system did generate a sell signal today. I guess the ramp up in the last 45 minutes of trading was a gift to get short near the highs of the day. We'll see...
It was clearly a ramp up/prop day just from looking at the charts!!! great gift for short as you said!
GS.
#4
NAV
-

- Traders-Talk User
- 16,087 posts
Member
Posted 16 July 2010 - 12:54 AM
According to Walker, "solely following the DI and -DI cross signals by themselves can lead to whipsaws and overtrading
Indeed !
I can tell you a more simpler technique to solve the whipsaw dilemma. Instead of just looking for a +DI and -DI cross, add an additional rule to your system, which is the black line on the ADX has to turn up after the +DI and -DI cross. That's the point the ADX signals that the market is in a trending mode.
If you look at the current setup, the +DI and -DI cross has occured, but the black line is still pointing down, which suggests that the daily trend is still down. the moment your black line turns up, with the current cross intact, you woudn't want to be short this market, which would signify that the daily has started uptrending.
Edited by NAV, 16 July 2010 - 12:59 AM.
#5
diogenes227
-

- TT Patron+
- 5,120 posts
Member
Posted 16 July 2010 - 01:58 AM
You must be using the ADX on some time frame other than the daily to get that signal? Is that right?Hey Borland,
I trade by a variation of the ADX indicator and although I know nothing of the Extreme Point Trade Strategy, I must say that my ADX based system did generate a sell signal today. I guess the ramp up in the last 45 minutes of trading was a gift to get short near the highs of the day. We'll see...
"If you've heard this story before, don't stop me because I'd like to hear it again," Groucho Marx (on market history?).
“I've learned in options trading simple is best and the obvious is often the most elusive to recognize.”
"The god of trading rewards persistence, experience and discipline, and absolutely nothing else."
#6
goldswinger
-
- Traders-Talk User
- 2,612 posts
Member
Posted 16 July 2010 - 06:56 AM
According to Walker, "solely following the DI and -DI cross signals by themselves can lead to whipsaws and overtrading
Indeed !
I can tell you a more simpler technique to solve the whipsaw dilemma. Instead of just looking for a +DI and -DI cross, add an additional rule to your system, which is the black line on the ADX has to turn up after the +DI and -DI cross. That's the point the ADX signals that the market is in a trending mode.
If you look at the current setup, the +DI and -DI cross has occured, but the black line is still pointing down, which suggests that the daily trend is still down. the moment your black line turns up, with the current cross intact, you woudn't want to be short this market, which would signify that the daily has started uptrending.
Thanks NAV for your input, I use it also sparingly. I think a good way to look at it based on what you said , is do not do counter trend trade if the black line indicates trending this happens well after an up move starts or a down move starts, but the confidence level is very high as that's the sweet spot of the trend where the biggest moves occur.
GS.
#7
redwraith
-
- Traders-Talk User
- 43 posts
Member
Posted 16 July 2010 - 08:06 AM
You must be using the ADX on some time frame other than the daily to get that signal? Is that right?Hey Borland,
I trade by a variation of the ADX indicator and although I know nothing of the Extreme Point Trade Strategy, I must say that my ADX based system did generate a sell signal today. I guess the ramp up in the last 45 minutes of trading was a gift to get short near the highs of the day. We'll see...
No, I use the daily time frame, though like I said, it's a variation of the traditional interpretation of the relationship between the DI-, DI+ and ADX. The pop at the end of the day yesterday concerns me in relation to a sell signal, so I am going to use it to hedge a covered call position I have in SSO, instead of going absolutely short.


