Just a quick comment while Im still campaigning for my friend in California
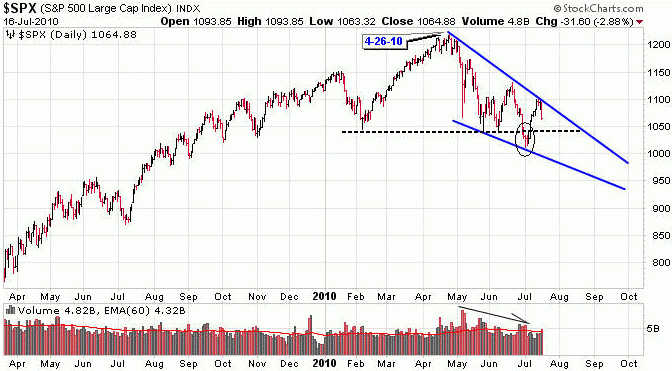
I think theres way too much bearishness all over the place, from media to individual traders. For one thing, on Friday, the 21-month (420 days) SMA had just made a new high since it moved into the positive territory on June 8, 2010. And, that was the first time it had ever stuck its head above water in almost 2 years, since it dived into the negative territory on 6-16-2008.
For another thing, Intel (INTC) had just had a bullish Falling Wedge Breakout on huge surge of volume. Incidentally, $21 appears to be a good long entry point.
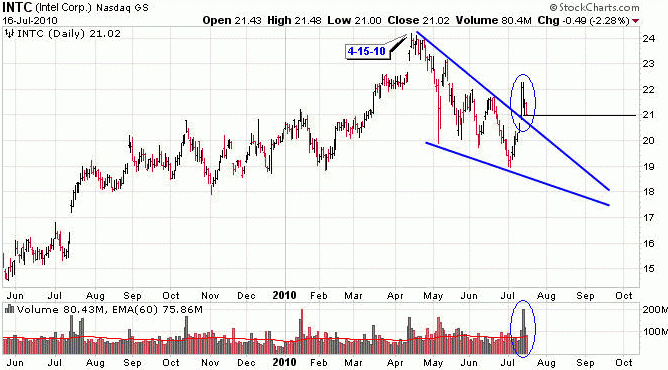
INTC had led the way down in April (about 2 weeks ahead of the SPX), and it may be leading the way up by being one of the 1st ones to break out of the ubiquitous Falling Wedge pattern. BTW, the Head & Shoulders top that had been talked about was but a head fake. The breakdown was invalidated by lower volume than the Head. This mightve attributed to the overall market sentiment improvement last week.
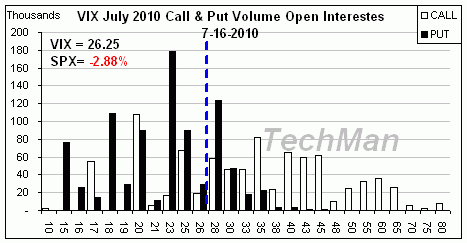
And, finally, the Open Interests of the VIX July 2010 options that are due to expire on Wednesday appear to be quite bullish as the Put volume remains overwhelmingly higher than the Call volume.
And, thats it for me
Ill try to check back from time to time but not sure how often. Have a great trading week ahead!

 INTC had led the way down in April (about 2 weeks ahead of the SPX), and it may be leading the way up by being one of the 1st ones to break out of the ubiquitous Falling Wedge pattern. BTW, the Head & Shoulders top that had been talked about was but a head fake. The breakdown was invalidated by lower volume than the Head. This mightve attributed to the overall market sentiment improvement last week.
 And, finally, the Open Interests of the VIX July 2010 options that are due to expire on Wednesday appear to be quite bullish as the Put volume remains overwhelmingly higher than the Call volume.
 And, thats it for me
Ill try to check back from time to time but not sure how often. Have a great trading week ahead!
And, thats it for me
Ill try to check back from time to time but not sure how often. Have a great trading week ahead!


 I agree with you in the IT although I'm positioned short (SDS) for tomorrow and may add on a bounce (TZA) before going flat by the end of the day. We shall see if my scenario works out or I have to abort the whole deal.


