Jump to content


Photo

Secular Bear Market in Nasdaq (2000-2009?) is Over?


  • Please log in to reply
33 replies to this topic

#1 inamosa

inamosa

    Patterns-based Trader and Investor in ETFs and Futures

  • Traders-Talk User
  • 1,638 posts

Posted 05 December 2010 - 03:17 PM

Even within the most frustrating of market environments there is always opportunity waiting to be found somewhere if only you take the time to look for it.

Posted Image

Once it takes out the 2007 high, it will have officially made a higher low (2009 vs 2000) and higher high (201? vs 2007). However, until it does, it's too early to say for sure a new secular bull market has started.

But, if we take a look at stocks like Apple, Amazon, Priceline, etc., it's clear that certain components of the Nasdaq are already in secular bull markets.

---

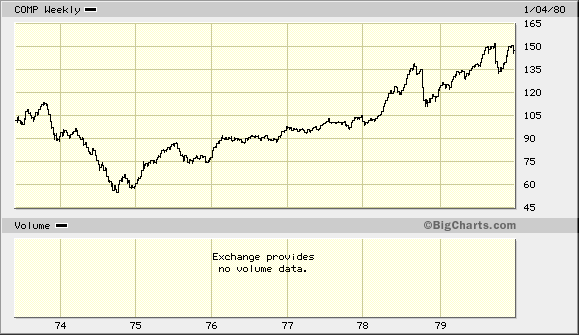
Let's not forget: in the treacherous trading environment of the 1970s, investors tended to concentrate their attention on the directionless Dow, which only added to their misery. The tech sector as reflected by the NASDAQ Composite Index, however, was making steady upward progress at that time. By the end of the ‘70s, the NASDAQ experienced a blow-out performance on the upside compared to the Dow and it was clear that the tech stocks had begun their secular bull market earlier than most other stocks.

Posted Image
"Our job is not to predict where the market will go, but to interpret daily price and volume action to ascertain the facts of the current environment and make decisions based on that interpretation."
-Scott O'Neil (son of William O'Neil), Portfolio Manager at O’Neil Data Systems, when asked where the Dow would go in the coming months

#2 IYB

IYB

    Member

  • TT Patron+
  • 7,146 posts

Posted 05 December 2010 - 04:24 PM

Hi Aly. By the definition that has served me well for decades, we are smack dab in the middle of the 2000 to 2018 (+ or -) secular bear market as defined by "shrinking valuations, shrinking public participation, declining speculation, and range bound prices" regardless of whether or not we surpass the 2007 highs. This will only be over when out in the 20's, we embark on a multiple expansion taking us to at least 7 or 8 times the 2000 high, or 35000+. But that's still a very long time off. Still more work to be done over coming years within the Secular Bear Market.

The Primary Cycle, OTOH, has been in a Cyclical Bull Market since March 2009 and continues. That's how I size it up, fwiw.

And by the way - Your quote from Eccl. is every bit as true and relevant in 2010 A.D. as it was in 2010 B.C. :) Very Best Regards, D
------
From SevenSentinels.com:

The "40-Year Cycle"

The Super Cycle, otherwise known as the Secular Trend is often called the "20-year cycle" (actually a 40-year cycle when taken peak to peak or trough to trough) because it defines the market environment for a whole generation of traders and investors, and tends to change roughly every 18-20 years from secular bull market to secular bear market, then back to secular bull again, ad infinitum.

Secular BULL markets are typically 18 (+ or - 3) year periods characterized by expanding valuations (P/E ratios, etc.), expanding public participation in equity markets, expanding speculation, and sharply rising prices. During a secular bull market, the entire Dow Jones Industrial Average or S&P500 will expand by as much as 10-15 fold or more. 1982 to 2000 was an excellent example of a secular bull market in all regards, as the Dow Jones Industrial Average expanded from the 700's to well over 10,000 in those 18 years.

Secular BEAR markets, by contrast, are periods of roughly the same length of time which are characterized by shrinking valuations, shrinking public participation, declining speculation, and range bound prices. The 1965 to 1982 secular bear market, for example, kept the Dow Jones Industrial Average range bound between roughly 500 and 1000 for that entire period as valuations, participation and speculation shrank markedly. The current secular bear market which began from the 2000 valuation peak clearly shares these characteristics, as even casual study will demonstrate.

Notice in the chart below 6 distinct secular cycles: 1909-1929 secular bull market (expanding), 1929-1945 secular bear (rangebound), 1945-1965 secular bull (expanding), 1965-1982 secular bear (rangebound). 1982-2000 secular bull (expanding), 2000-present secular bear (rangebound). We can expect that the current secular bear market, bound in the range of roughly DJ 6000-14000 to run until late in the next decade (2017+or-) at which time we can reasonably expect the onset of the next secular bull market which could take us another 15X+ higher to the area of 100,000 Dow Jones Industrial Average.

Posted Image

Edited by IYB, 05 December 2010 - 04:29 PM.

“Men, it has been well said, think in herds; it will be seen that they go mad in herds, while they only recover their senses slowly, one by one.” Charles Mackay, Extraordinary Popular Delusions and the Madness of Crowds

#3 arbman

arbman

    Quant

  • Traders-Talk User
  • 19,504 posts

Posted 05 December 2010 - 04:26 PM

Nasdaq may have bottomed though, most large cap Nasdaq stocks do NOT have the same debt problems, but growth problems. More importantly, Nasdaq put a higher low during one of the worst historic collapse in 2008. I don't know where will the selling come from to take them to any worse condition than they suffered during the 2000-2003 bear market either. However, for the long term, it will take a lot of years to surpass the 2000 highs for Nasdaq... Probably another 10 years...

Edited by arbman, 05 December 2010 - 04:27 PM.


#4 inamosa

inamosa

    Patterns-based Trader and Investor in ETFs and Futures

  • Traders-Talk User
  • 1,638 posts

Posted 05 December 2010 - 04:45 PM

Hi Aly. By the definition that has served me well for decades, we are smack dab in the middle of the 2000 to 2018 (+ or -) secular bear market as defined by "shrinking valuations, shrinking public participation, declining speculation, and range bound prices" regardless of whether or not we surpass the 2007 highs. This will only be over when out in the 20's, we embark on a multiple expansion taking us to at least 7 or 8 times the 2000 high, or 35000+. But that's still a very long time off. Still more work to be done over coming years within the Secular Bear Market.

The Primary Cycle, OTOH, has been in a Cyclical Bull Market since March 2009 and continues. That's how I size it up, fwiw.

And by the way - Your quote from Eccl. is every bit as true and relevant in 2010 A.D. as it was in 2010 B.C. :) Very Best Regards, D
------
From SevenSentinels.com:

The "40-Year Cycle"

The Super Cycle, otherwise known as the Secular Trend is often called the "20-year cycle" (actually a 40-year cycle when taken peak to peak or trough to trough) because it defines the market environment for a whole generation of traders and investors, and tends to change roughly every 18-20 years from secular bull market to secular bear market, then back to secular bull again, ad infinitum.

Secular BULL markets are typically 18 (+ or - 3) year periods characterized by expanding valuations (P/E ratios, etc.), expanding public participation in equity markets, expanding speculation, and sharply rising prices. During a secular bull market, the entire Dow Jones Industrial Average or S&P500 will expand by as much as 10-15 fold or more. 1982 to 2000 was an excellent example of a secular bull market in all regards, as the Dow Jones Industrial Average expanded from the 700's to well over 10,000 in those 18 years.

Secular BEAR markets, by contrast, are periods of roughly the same length of time which are characterized by shrinking valuations, shrinking public participation, declining speculation, and range bound prices. The 1965 to 1982 secular bear market, for example, kept the Dow Jones Industrial Average range bound between roughly 500 and 1000 for that entire period as valuations, participation and speculation shrank markedly. The current secular bear market which began from the 2000 valuation peak clearly shares these characteristics, as even casual study will demonstrate.

Notice in the chart below 6 distinct secular cycles: 1909-1929 secular bull market (expanding), 1929-1945 secular bear (rangebound), 1945-1965 secular bull (expanding), 1965-1982 secular bear (rangebound). 1982-2000 secular bull (expanding), 2000-present secular bear (rangebound). We can expect that the current secular bear market, bound in the range of roughly DJ 6000-14000 to run until late in the next decade (2017+or-) at which time we can reasonably expect the onset of the next secular bull market which could take us another 15X+ higher to the area of 100,000 Dow Jones Industrial Average.

Posted Image


Hi Don,

Thank you for your post. Always enlightening.

All that I'm suggesting is that a new secular bull market may have already started in the Nasdaq Composite, and this would be confirmed if the 2007 highs in it are broken. This still means most non-tech companies will be weighed down for another 3-9 years until the current secular bear market is over for them.

For example, this happened in 1974, when tech stocks started a new secular bull market (after topping in '66) even though most non-tech stocks didn't start making new multi-year highs until 1981 or shortly thereafter. By the end of the ‘70s, the NASDAQ experienced a blow-out performance on the upside compared to the Dow and it was clear that the tech stocks had begun their secular bull market earlier than most other stocks.

As I alluded to, if we take a look at stocks like Apple, Amazon, Priceline, Illumina, Intuit, etc. (not to mention companies like Baidu, Netflix, and Google which weren't around back in 2000), it's clear that certain components of the Nasdaq are already in secular bull markets. Additionally, relative strength of the Nasdaq vs the S&P suggests that a new high in the Nasdaq Composite could easily occur within the next several months. This will be a very important development if / when it happens.

To summarize, to me, the 2009 bottom is like the 1974 bottom.
Posted Image
Posted Image

The Nasdaq flew to the upside while the Dow and most other non-tech stocks continued to languish for another eight or so years.

Edited by alysomji, 05 December 2010 - 04:50 PM.

"Our job is not to predict where the market will go, but to interpret daily price and volume action to ascertain the facts of the current environment and make decisions based on that interpretation."
-Scott O'Neil (son of William O'Neil), Portfolio Manager at O’Neil Data Systems, when asked where the Dow would go in the coming months

#5 Gary Smith

Gary Smith

    Member

  • Traders-Talk User
  • 887 posts

Posted 05 December 2010 - 04:48 PM

Even within the most frustrating of market environments there is always opportunity waiting to be found somewhere if only you take the time to look for it.

Let's not forget: in the treacherous trading environment of the 1970s, investors tended to concentrate their attention on the directionless Dow, which only added to their misery. The tech sector as reflected by the NASDAQ Composite Index, however, was making steady upward progress at that time. By the end of the ‘70s, the NASDAQ experienced a blow-out performance on the upside compared to the Dow and it was clear that the tech stocks had begun their secular bull market earlier than most other stocks.

Posted Image


Thank you, thank you, and thank you!!! One of my all time pet peeves (the other being the omitting of the reinvestment of compounded dividends) and something I have mentioned here and there many times in the past is the harping on the 1966-1982 bear market while missing the bigger picture. Fact is the average stock bottomed in late 1974 and it was up, up and away after that. If you could post a chart for the more comprehensive Value Line Index for that same time period it would reflect it even better than your Nasdaq chart. The small cap stocks embarked on their greatest bull market of a lifetime in late 74 averaging something like 33% per annum for the next six to seven years. As you succinctly say, in even the most frustrating of market environments there is always opportunity to be found somewhere if only you take the time to look for it. Back in the mid to late 70s, it about hit you over the head. Too bad for me back then I was too young, dumb, inexperienced, and undercapitalized to profit from it.

Edited by Gary Smith, 05 December 2010 - 04:49 PM.


#6 Gary Smith

Gary Smith

    Member

  • Traders-Talk User
  • 887 posts

Posted 05 December 2010 - 04:56 PM

>>>>To summarize, to me, the 2009 bottom is like the 1974 bottom<<<< alysomji, you posted that after it was too late to edit my prior post and I couldn't agree more and surprised this hasn't been brought up before. Indeed, a once in a generation buying opportunity.

#7 inamosa

inamosa

    Patterns-based Trader and Investor in ETFs and Futures

  • Traders-Talk User
  • 1,638 posts

Posted 05 December 2010 - 05:34 PM

Let me make it more clear:

Nasdaq Composite - 1973-79 vs S&P 500 - 1973-79
Posted Image
Posted Image


Nasdaq Companies Already in Secular Bull Markets
Apple (AAPL)
Posted Image

Amazon (AMZN)
Posted Image

Illumina (ILMN)
Posted Image

Intuit (INTU)
Posted Image

Priceline (PCLN)
Posted Image


...not to mention companies like Baidu, Netflix, and Google which weren't around back in 2000...and there are others for those of you willing to do a little homework.

P.S.
I know many of you have been looking at this bear market like it's the one in the '30s. It's true that from 2000-2009, we tracked 1929-38 very closely. However, as Niall Ferguson, author of "The History of Money" recently put it: "We’re going to get the 1970s for fear of the 1930s."

So, once again, look at 2009 as the functional equivalent of 1974.
"Our job is not to predict where the market will go, but to interpret daily price and volume action to ascertain the facts of the current environment and make decisions based on that interpretation."
-Scott O'Neil (son of William O'Neil), Portfolio Manager at O’Neil Data Systems, when asked where the Dow would go in the coming months

#8 IYB

IYB

    Member

  • TT Patron+
  • 7,146 posts

Posted 05 December 2010 - 05:38 PM

Hi Don,

Thank you for your post. Always enlightening.

All that I'm suggesting is that a new secular bull market may have already started in the Nasdaq Composite, and this would be confirmed if the 2007 highs in it are broken. This still means most non-tech companies will be weighed down for another 3-9 years until the current secular bear market is over for them.

For example, this happened in 1974, when tech stocks started a new secular bull market (after topping in '66) even though most non-tech stocks didn't start making new multi-year highs until 1981 or shortly thereafter. By the end of the ‘70s, the NASDAQ experienced a blow-out performance on the upside compared to the Dow and it was clear that the tech stocks had begun their secular bull market earlier than most other stocks.

As I alluded to, if we take a look at stocks like Apple, Amazon, Priceline, Illumina, Intuit, etc. (not to mention companies like Baidu, Netflix, and Google which weren't around back in 2000), it's clear that certain components of the Nasdaq are already in secular bull markets. Additionally, relative strength of the Nasdaq vs the S&P suggests that a new high in the Nasdaq Composite could easily occur within the next several months. This will be a very important development if / when it happens.

To summarize, to me, the 2009 bottom is like the 1974 bottom.

The Nasdaq flew to the upside while the Dow and most other non-tech stocks continued to languish for another eight or so years.

Points taken, and they are excellent ones Aly. Thanks. My point is more about semantics, and the way that I have compartmentalized trends over the years- in a way that "works" extremely well for me in understanding the context of each trend within larger cycles. Understanding the context of trends within larger trends keeps me grounded in a extreemly important way.

But your point about 2009 quite possibly being a bottom for certain components within that secular bear phase, as 1974 was for certain small caps -- is an important one - and it speaks to leadership and stock selection during those times one is long within IT and cyclical bull phases {during what I steadfastly regard as a secular bear market ;) }. I address those in terms of relative strength and "leadrship stocks".

You mentioned >>>>As I alluded to, if we take a look at stocks like Apple, Amazon, Priceline, Illumina, Intuit, etc. (not to mention companies like Baidu, Netflix, and Google which weren't around back in 2000)<<<<

As you know I been trading many (most) of those names long and have posted the charts here at FF this year - some repeatedly.

So we are saying the same thing in a different way. Many thanks for your keen insight and keep up the great work. Regards, D

From SS.com:


We have screened the top performing stocks by relative strength, trading liquidity, earnings and revenue growth, and Investors Business Daily Composite Ranking, and have selected the twenty issues which we regard as the "hottest" issues for trading in October 2010. We will be trading in and out of these issues as opportunities are presented.

Rather than put images of each of those twenty here, we instead posted them at Fearless Forecasters here and by clicking on that link you can see all twenty charts updated right up to the minute at the time you click. The twenty are those consecutive charts at the end of that string beginning with AAPL and concluding with WBD.

As indicated above, we will look to trade in and out of these issues as opportunities are presented. The full list is as follows

AAPL (Apple Computer)
AMZN (Amazon)
ASYS (Amtech Systems)
BBD (Banco Bradesco)
BIDU (Baidu, Inc.)
BORN (China New Borun Corp.)
CTRP (Ctrip Com Intl Ltd)
DGP (Gold ETF)
EDC (Emerging Stock ETF)
FFIV (F5 Networks)
GOOG (Google)
LVS (Las Vegas Sands)
NFLX (Netflix)
ORCL (Oracle)
PCLN (Priceline)
RADS (Radiant Systems)
ROVI (Rovi Corp)
SCCO (Southern Copper)
SKWS (Skyworks Solutions)
WBD (William-Bill-Dann Foods)

Edited by IYB, 05 December 2010 - 05:48 PM.

“Men, it has been well said, think in herds; it will be seen that they go mad in herds, while they only recover their senses slowly, one by one.” Charles Mackay, Extraordinary Popular Delusions and the Madness of Crowds

#9 inamosa

inamosa

    Patterns-based Trader and Investor in ETFs and Futures

  • Traders-Talk User
  • 1,638 posts

Posted 05 December 2010 - 05:44 PM

Indeed, Don. You have been trading the right names over the past year, without a doubt. Thank you for your comments. I will send you an email with more details. cheers, Aly
"Our job is not to predict where the market will go, but to interpret daily price and volume action to ascertain the facts of the current environment and make decisions based on that interpretation."
-Scott O'Neil (son of William O'Neil), Portfolio Manager at O’Neil Data Systems, when asked where the Dow would go in the coming months

#10 IYB

IYB

    Member

  • TT Patron+
  • 7,146 posts

Posted 05 December 2010 - 05:54 PM

Thanks Aly. Great work, again, and I'll look forward to email.

The 20 mentioned above are linked by chart here.
“Men, it has been well said, think in herds; it will be seen that they go mad in herds, while they only recover their senses slowly, one by one.” Charles Mackay, Extraordinary Popular Delusions and the Madness of Crowds