
(This is an excerpt from May 13, 2011 issue of the blog for Decision Point subscribers.)
Recently I found something interesting regarding our volume indicators. First, we have been observing that the Advance-Decline Volume Line has not confirmed the new price highs for many months (see chart below), and this condition has been reflected in all indicators that use A-D Volume numbers. This indicator is calculated daily by subtracting the volume of declining stocks and adding the volume volume of advancing stocks to a cumulative total. The problem with this indicator is that low-priced, high-volume stocks can have undue influence on the volume trend.

This week I realized that our Dollar-Weighted Volume (DWV) index was a better indicator for comparing price to volume, and confirming new price highs. It is calculated similarly to A-D Volume, but, additionally, volume for each stock is multiplied by the stock price, and that result is used for the cumulative total. The result is that we can see if net dollars are going into advancing or declining stocks. As you can see this version of volume analysis confirms the rising price trend of the bull market that began in 2009, as well as the series of new highs from the 2010 low to the present.
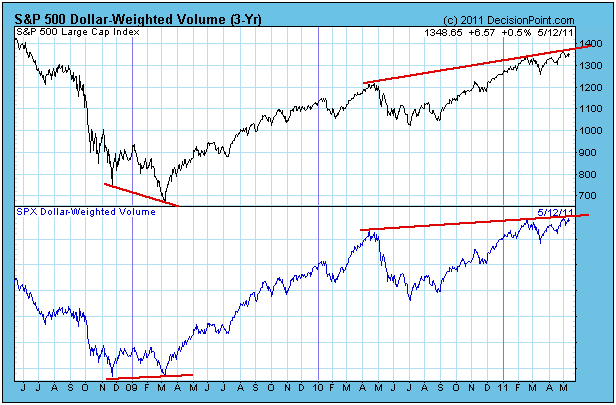
Another prominent feature on this chart is the obvious positive divergence that occurred at the bear market low in March 2009. At the time it would have been a strong sign that the bear market was over.
We have been collecting data for this indicator for years, but I have found it to be extremely boring because it usually tracks price movement so closely. As it turns out, that is a good thing, because it is a reliable confirming indicator. On the rare occasions when it doesn't confirm price movement, it is even more valuable.
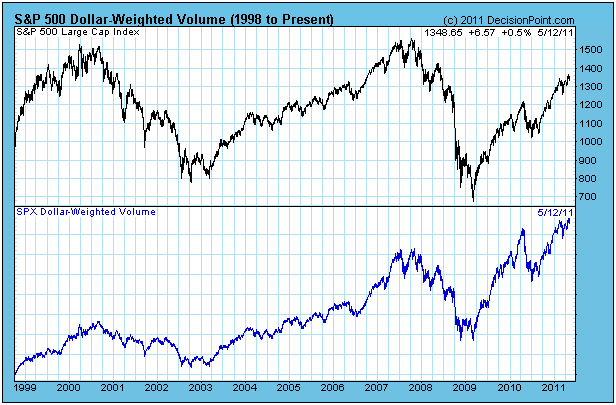
While DWV appears to be a useful tool in the short- and medium-term, in the longer-term the chart below shows that it has an upward bias and is of no use in that time frame. This upward bias is caused by the fact that prices during declines, obviously, keep getting lower and lower, so the price multiplier generates a smaller result, unless volume increases proportionately, which apparently it doesn't. If I recall correctly, in general bear market volume tends to be lower than bull market volume.
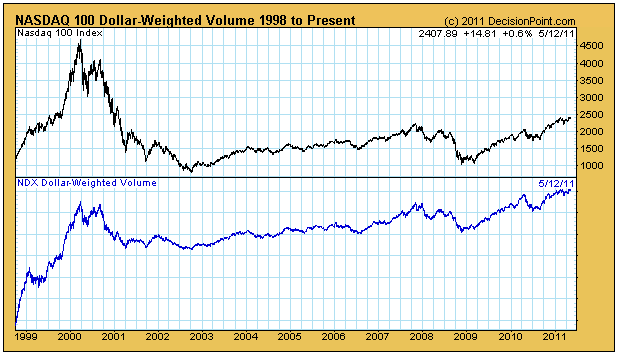
The Nasdaq 100 chart of DWV profoundly emphasizes the long-term upward bias of DWV.
Bottom Line: The Dollar-Weighted Volume indicator is a valuable tool for confirming price performance in the short- and medium-term, and it is clearly superior to the traditional Advance-Decline Volume Line. It's long-term upward bias makes it of no value in that time frame.
As far as I know, this indicator is exclusive to DecisionPoint.com.
CLICK HERE TO SUBSCRIBE!
* * * * * * * * * * * * * * * * * * * * *
Technical analysis is a windsock, not a crystal ball.
* * * * * * * * * * * * * * * * * * * * *

* * * * * * * * * * * * * * * * * * * * *
Carl BIO: Carl Swenlin is a self-taught technical analyst, who has been involved in market analysis since 1981. A pioneer in the creation of online technical resources, he is president and founder of DecisionPoint.com, a premier technical analysis website specializing in stock market indicators, charting, and focused research reports. Mr. Swenlin is a Member of the Market Technicians Association.
* * * * * * * * * * * * * * * * * * * * *


