

A Technical View of S&P 500 and DOW Stock Market Trends - Mike Swanson (08/03/11)
Yesterday was an ugly today. This morning S&P 500 futures are up before the opening bell as traders bet on a rebound, but there is no way to deny that yesterday was a troubling day when it comes to the financial markets.
Things look even worse in the European markets where Germany and Italy broke down to new lows for the summer. Israel also dumped hard and so did Japan. Asian markets are acting the strongest for now though.
Yes we saw the DOW fall over 200 points on big volume Tuesday. We saw the VIX, which measures the volatility premium options traders are paying, jump up a few percentage points and the ratio of sell to buy orders on the NYSE and Nasdaq hit the nine to one level. But oddly the put/call ratio closed below one, meaning that even with yesterday's big selling options players were not too concerned and were buying more calls than puts.
You would think they would have been scared, but they weren't.
On Monday I wrote in my monthly newsletter how all of the moves of this summer must be put in the context that the market is in a wide trading range and will continue to be choppy with UNSUSTAINABLE moves to both the upside and to the downside until the trading range is resolved. I thought Monday that it would end up being resolved to the upside by early September, but Tuesday's sharp move down puts that view into question. Time will tell.
In a trading range market the news really hasn't matter much. Last week the market fell and everyone thought that it was falling because of the negotiations over the debt limit. That would mean once that problem was resolved the market could go up - but it didn't. That means the debt limit issue wasn't what was really driving the action in the market.
What really is are big trends. And there are two big trends the market is dealing with - money printing and the hope of more money printing from the Fed to make the stock market go up and the countervailing trend of a weak global economy and debt problems impacting Europe. So you have a market that is under pressure due to economic issues and can go up on hope of money printing action.
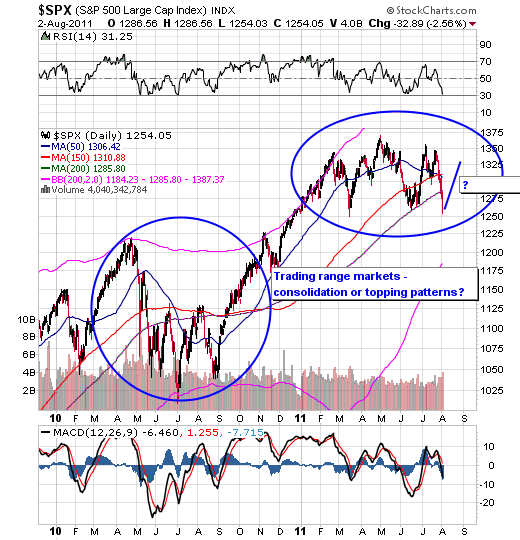
In trading range markets the market looks great when it gets to the top of its range and makes people feel good so they get sucked into buying at tops and then when it falls down to the bottom of the range people get scared silly so you don't want to get too negative right now.
Short-term the stock market has fallen so quickly over the past few sessions that some sort of bounce is in order. If it can bounce here then I would expect it to retrace 1/2 to 1/3 of the losses it has made since its March/April peak. That would take the S&P 500 up into the 1316-1326. That would be a big bounce from here and the market probably would need to consolidate a few days first before it could move that much higher. More selling could happen.
But if it does at this point I wouldn't expect much more downside from here.
So short-term we should get a bounce in the market averages.
After that though I'm really not sure. Once that bounce is over the market will either simply fall again - in which case it will be in danger of slipping into a bear market - or else it will pause for a few weeks and put itself in a position to breakout to new highs and make a run like it did at the end of last summer.
I'll evaluate the strength of the next bounce to look for clues to which is more likely.
There are two things that are different now from last year which are troubling. One is that last year from April to August sentiment, according to surveys such as Investors Intelligence, grew more and more negative on the market. Just before the market took off in August there were in fact more bears than bulls in the Investors Intelligence survey. This summer sentiment has not gotten overly negative in these surveys.
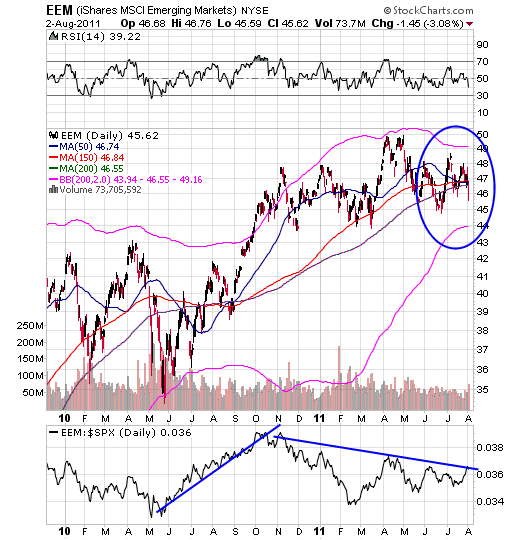
The action in emerging markets is interesting now. Most of Europe has traded weaker than the US the past few months, however several of the Asian markets have been stronger. The emerging markets ETF has been in an even narrower trading range than the US broad market averages and this has caused its 200-day Bollinger bands to narrow.
Since the first few months of 2008 the action in emerging markets has tended to lead that of the US. If the EEM ETF can break through its 200-day Bollinger Band this month I'd take that as a sign that we're going to get a bullish resolution in the US markets this summer. However, if it falls down to its lower 200-day Bollinger Band I'd take that as a negative sign. This is an ETF worth watching carefully over the next couple of weeks.


