Jump to content


Photo

Laws Of Line -


  • Please log in to reply
140 replies to this topic

#41 iloli way

iloli way

    iloli = I'm Laws Of Line's I(eye)

  • TT Member*
  • 4,010 posts

Posted 10 June 2012 - 10:30 PM

Geomean and Echo,

Hsieh Hsieh ! for the kind words, I am just very happy someone's is reading my stuff which are so unconventional, using NONE of the known TA tools. You guys are welcomed to make any comments, or questions any time, I'd remain all ears for good listening sound of 'musics'.

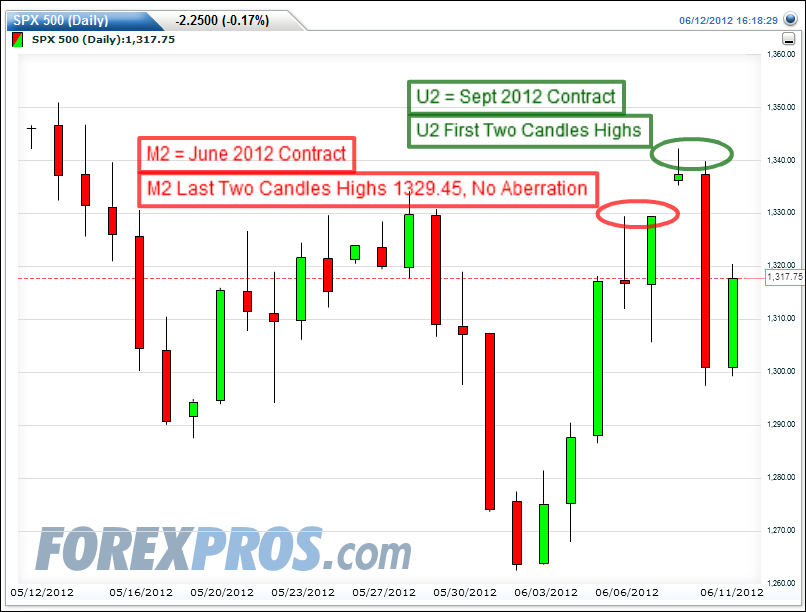
About 'rollover date', I find nothing particular obtrusive to the usefulness of this chart provider's charts. They picked the weekend, which is two days later than most, as the rollover date to switch chart data, in this case now, from M2 to U2 on Sunday's open. This month 6/1/2012 started on Friday, they must counted that week as first week, and June 7th is the rollover date.

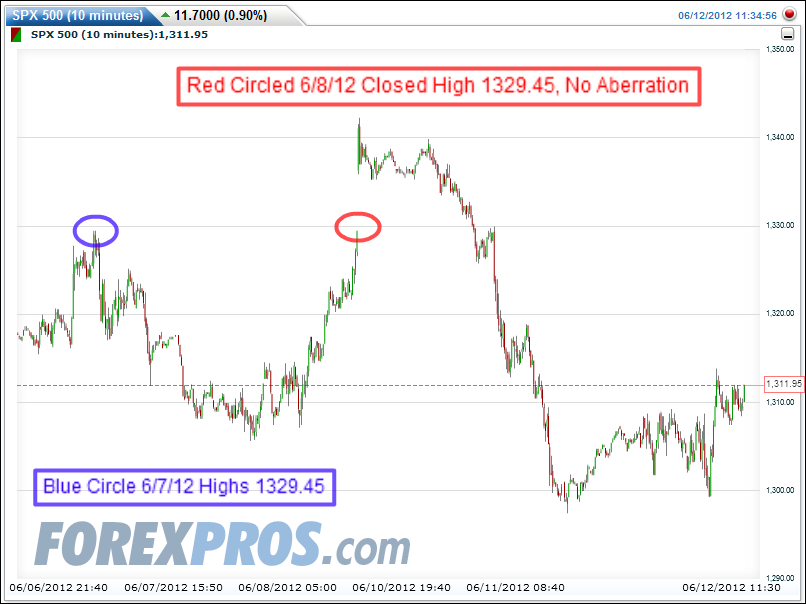
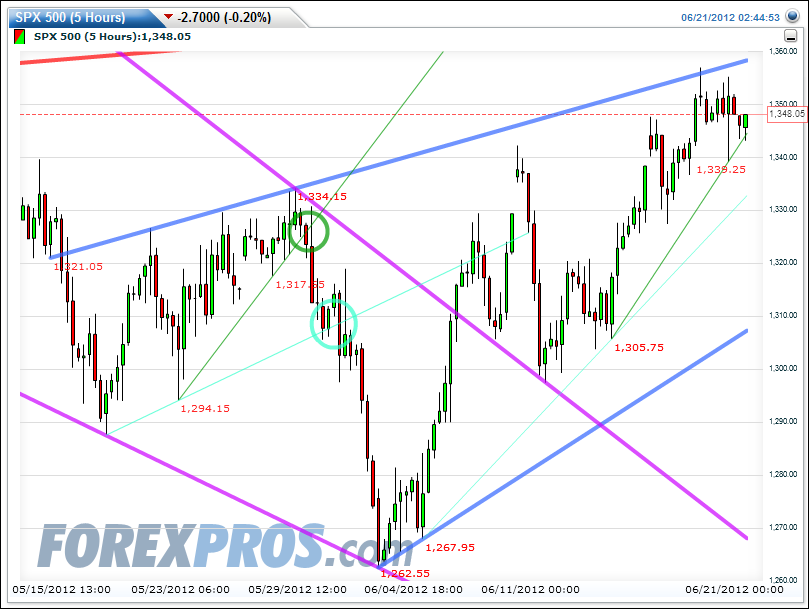
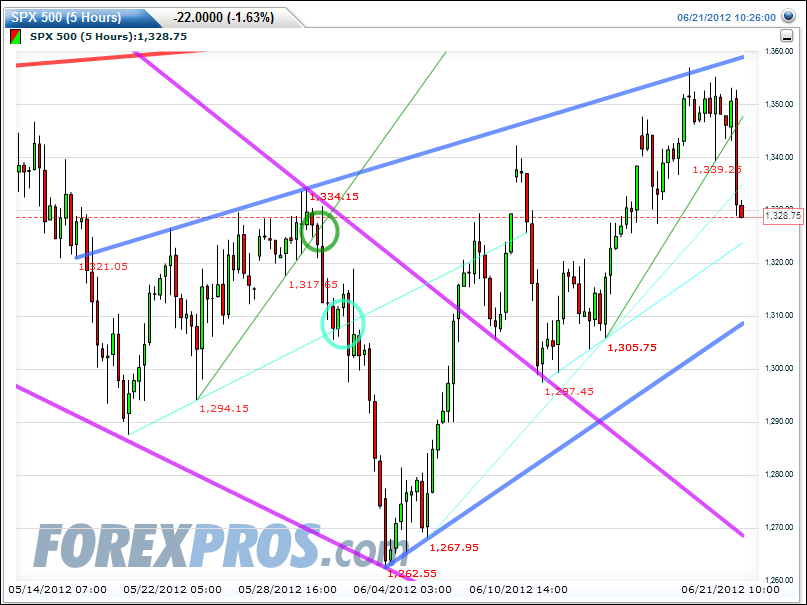
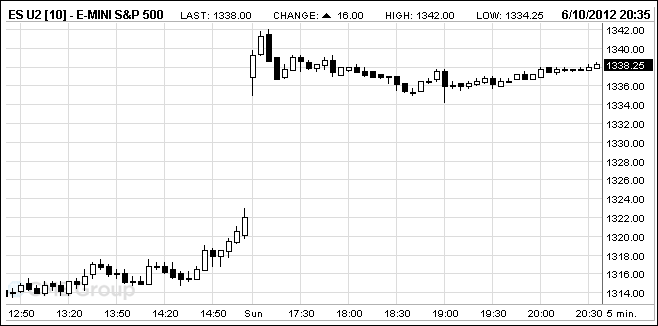
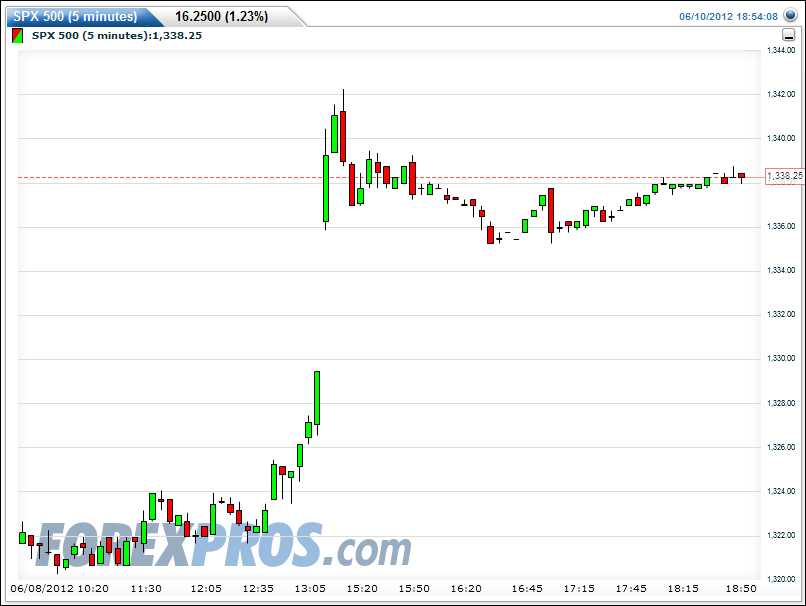
See two charts of the SAME TIME/same moments ago, first by CME (in CST), second by FOREXPROS (in PST): Note the CME one has a wrong 'CHANGE" price of up 16.00; while chart candle shows Friday's close was 1322.00, the correct change should be 16.25 just like the forexpros says. The forexpros one, last Fri's close stays at 1329.45, yet today's last price as clipped is 1338.25, the advance is +8.8, but see the price next to "SPX 500 (5mins)" title = +16.25 !; why is that? It already reflecting the U2 new price candles in today's chart and reporting a +16.25 from Friday's U2 closed price; while the chart candles remains in a 'continuous' mode without realign every candles prior to today's which still remain M2 prices. This proves to work just fine with TA, LOL, line drawing; like I said last time they are 'marked to market' prices.
Posted Image
Posted Image

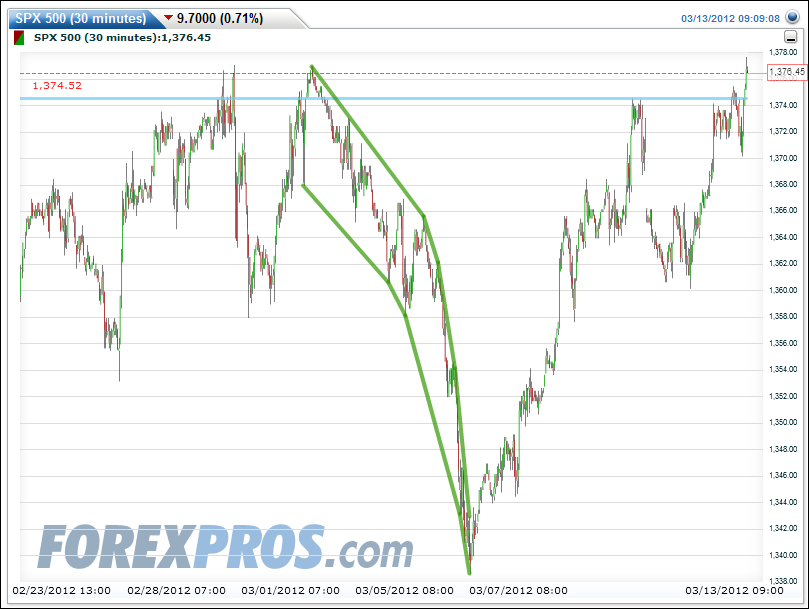
In fact, last rollover date in March, forexpros also rolled it on next Monday with a 6.20 pts drop, but it did not affect TA at all, it's on the rise any drop wouldn't matter. That week's chart was almost the fractal of last week's Sickle Play:

Tuesday, March 13, 2012 Posted by iloli

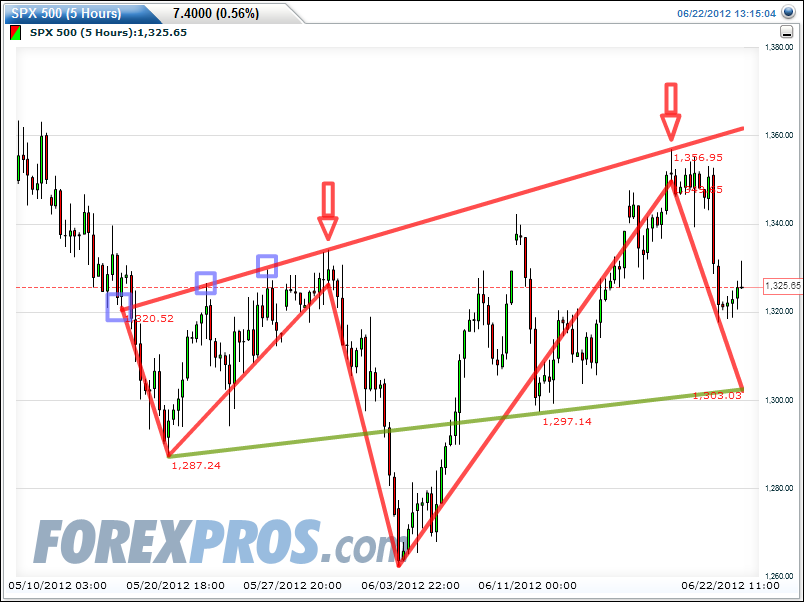
If we treat this as "V" Cup with Handle, or an Inverted H&S, then 1393 and 1410.50 are the targets respectively. (talk about chart of 9 AM)
Posted Image

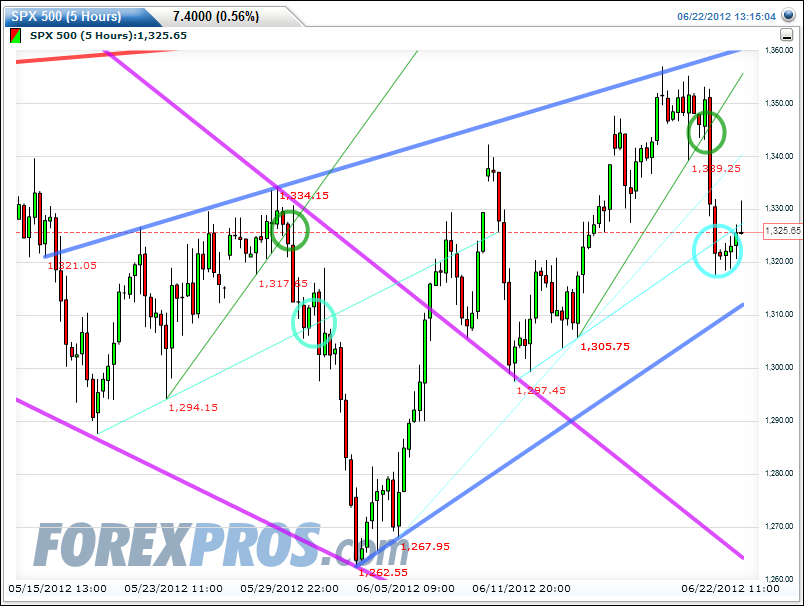
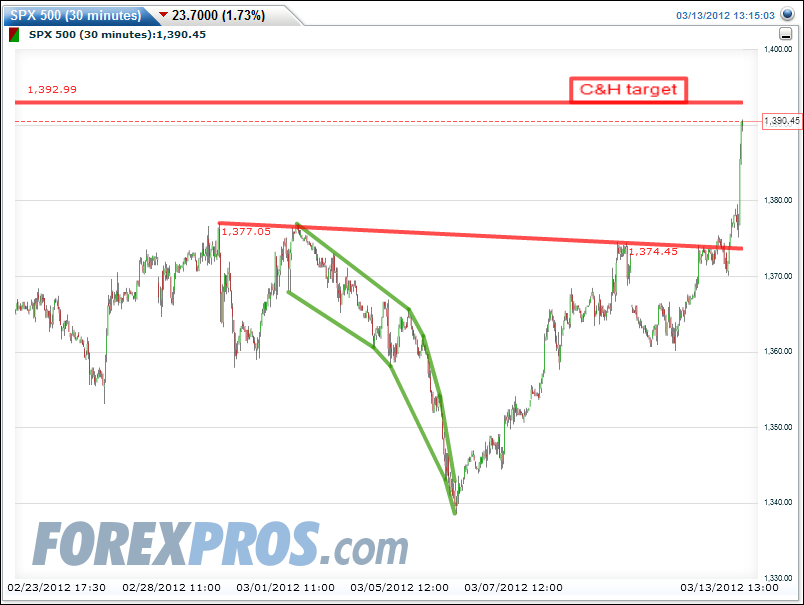
Let's look at ES closed "continuous" chart (without realign M12 to H12 to omit Monday's gap), our V Cup w/Handle target is almost reached. (talk about chart of 13:15 PM)
Posted Image


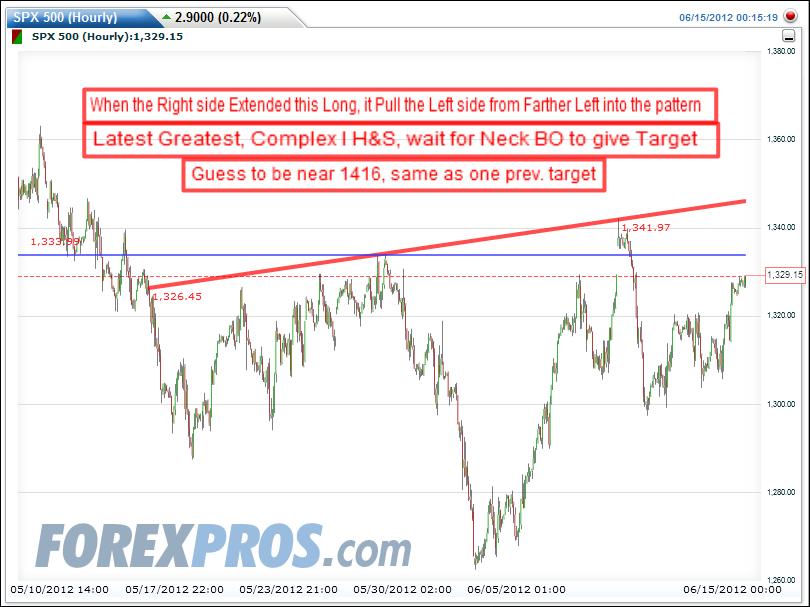
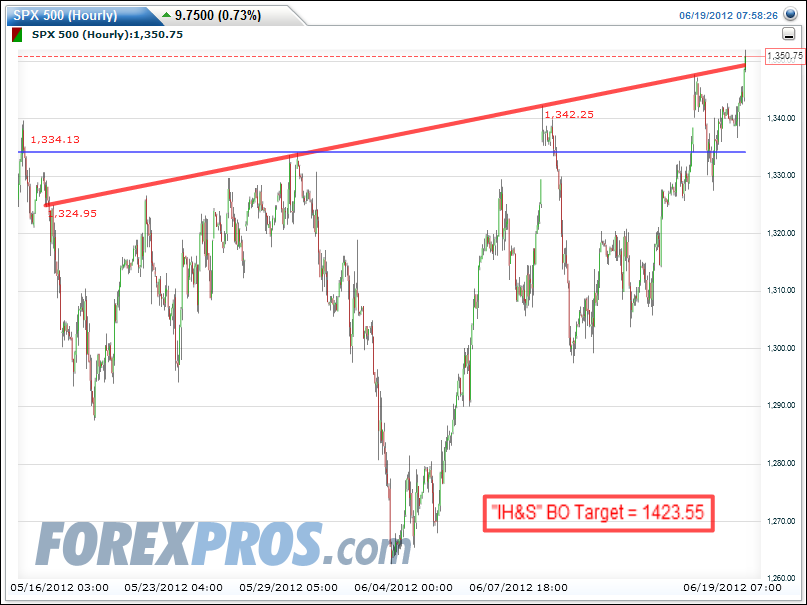
I won't post anything until my 1416 target reached; or my Red Sickle bottom got tanked. Good luck!

LOL! :lol:
PRICE IS KING; LINE RULES! - Laws Of Line (LOL) Trading Systems
Swing Those Lines: I can calculate the motion of heavenly bodies, but not the madness of people! -- Issac Newton

#42 iloli way

iloli way

    iloli = I'm Laws Of Line's I(eye)

  • TT Member*
  • 4,010 posts

Posted 12 June 2012 - 06:55 PM

Hi Doc,

Guess what, I replied to your first post only, i did not see your 2nd post until just this morning. When I last replied, I saw you as the last poster, but did not know you had two posts... I believe my last post actually resolved the issue. But since your 2nd post was specific about the "aberration" that you think FOREXPROS does every quarter at rollover of new actively traded contract. I just want to use this chance to clarify the misunderstanding you and some might still have, and settle this once and for all.

The chart you posted of 6/10 Sunday is probably during their readjusting to new month, there was no trade at the time anyway. When Sunday futures actually began trade, the Friday's closed price of 1329.45 was restored as I had already posted in last post. So there is no corruption or aberration to the forexpros chart data as you were alluded to. They don't miss 6 points every quarter, the gap up or gap down was only reflecting the coming new contract's new price. Now to further prove that's the case one more time, let's see today's chart of 10min and Daily to prove my point: Have a good day ! Thanks for remembering this for all this time, and gives me the chance to elaborate.
Posted Image
Posted Image
PRICE IS KING; LINE RULES! - Laws Of Line (LOL) Trading Systems
Swing Those Lines: I can calculate the motion of heavenly bodies, but not the madness of people! -- Issac Newton

#43 Echo

Echo

    Member

  • Traders-Talk User
  • 2,273 posts

Posted 13 June 2012 - 01:53 AM

Hi iloli, I think we are seeing the same think but the chart bothers me in that to the left of the Sunday gap, the June contract is charted and to the right, the Sept contract. I still contend that there is an aberration of sorts in that the June contract gapped up to 1349 in the opening minutes Sunday night if we want to compare apples to apples from Friday close to Sunday-Monday trading and if one is to draw trendlines that cross the rollover change in contracts, it is going to screw up various support,resistance and trend lines, no? My contention is that if you are going to draw lines, then the chart should be all June contract data or all Sept contract data but not half and half. That is my only point and it is a purist one. All price bars on your last chart from Sunday open onward should be 6-7 points higher to reflect the June contract equivalent since that is what is represented on the left hand side of the chart from last week. Again, you have put up some very nice forecasts so this hasn't affected you which is a good thing. It might if you draw lines across May through June into July. Then again maybe on that long a scale, the 6 points won't matter anyway. All the best to you. Doc

#44 iloli way

iloli way

    iloli = I'm Laws Of Line's I(eye)

  • TT Member*
  • 4,010 posts

Posted 19 June 2012 - 10:52 AM

Following up, continue of the lockstep chart series, as in L.O.L. as usual:

6/7/12:
Posted Image

6/11/12:
Posted Image

6/14/12:
Posted Image

6/19/12:
Posted Image

BTW, Doc, I can't be 'purist' in real-life tradings, if I choose to roll over to new month, I have to take whatever new price dealt me at the time. Reality is reality, when a chart reflects that, I can't and ain't gonna complain.
PRICE IS KING; LINE RULES! - Laws Of Line (LOL) Trading Systems
Swing Those Lines: I can calculate the motion of heavenly bodies, but not the madness of people! -- Issac Newton

#45 iloli way

iloli way

    iloli = I'm Laws Of Line's I(eye)

  • TT Member*
  • 4,010 posts

Posted 21 June 2012 - 02:47 PM

Around 2:40 AM PST (5:40 EST) over night, a line, the Thin Green Line in chart triggered a ST swing short. Targets, one at a time, the two Thin Light Blue Lines, and Dark Rising Wedge's lower TL. Breakdown beyond that would mean the 'downside targets shooting contest' has resumed.

Posted Image

About 8 hours later, 10:26 AM PST, this chart in progress:
Posted Image

30 mins before ES close: will cover when price back inside 2nd Light Blue line; OR down more and rebound from Dark Blue Wedge TL; whichever happens first.
Posted Image


Here's the Bigger Picture Patterns since the Mar/May tops:
Posted Image

In swinging the lines ST play, or pattern BO/BD IT play, same principle applies LOL: Lines are added ONLY AFTER evidence are there; and ALWAYS BEFORE prices actually touching them, giving enough time for actual trades. All my charts and lines are that: tradable and NOT after facts.

(BTW, adding 'circle', 'triangle' or 'square' is not possible in area around the last price. Simply no room to insert them. So just visually follow the line and price meeting point as the next circled juncture to-be.)
PRICE IS KING; LINE RULES! - Laws Of Line (LOL) Trading Systems
Swing Those Lines: I can calculate the motion of heavenly bodies, but not the madness of people! -- Issac Newton

#46 DrSP

DrSP

    Member

  • Traders-Talk User
  • 2,391 posts

Posted 23 June 2012 - 06:49 AM

Thanks, iloli. We are in an ascending wedge since ~ May 10th or so. Since ascending wedges can break lower, frequently at ~ 2/3 rds of the wedge, is it possible that we are going sharply below 1310 this time? What would be a confirmation that below 1310 scenario is off the table?
You could be a billionaire or an industrial worker or a teacher or a moderator of a forum - Hold a good conscience because that is what matters.

#47 iloli way

iloli way

    iloli = I'm Laws Of Line's I(eye)

  • TT Member*
  • 4,010 posts

Posted 26 June 2012 - 02:05 AM

Thanks, iloli. We are in an ascending wedge since ~ May 10th or so.

#1 ---Since ascending wedges can break lower, frequently at ~ 2/3 rds of the wedge,

#2 ---is it possible that we are going sharply below 1310 this time?

#3 ---What would be a confirmation that below 1310 scenario is off the table?

Hi DrSP, sorry late in reply than I'd like to. Had problem with Forexpros charting Sunday, so been only updating my blog, OK now.

I trade between lines that I can pre draw per evidence provided by price. BO/ BD is only head and tail, the continuation is the middle part of the fish. Even tho I don't ask myself the same questions as you do (therefore I think I can't give you answers that you'll be satisfy with), but I do have answers derived from using my LOL methods for each of your questions.

#1 --- I know you did not post a question here, but my BD target for Dark Blue Rising Wedge is 1271.

#2 --- Yes possible. If you'd followed my work (sometimes I have to work hard to follow my own lol!) the top of the last Red Sickle 1334 has to hold in order to go new high over Mar/May's. We lost 1334 now, so the 5/6 four downside targets and 1288, 1276, 1262 all possible.

#3 --- Needs to rebound hard and strong from 1310, more precisely, rebound hard from the lower TL of rising wedge posted last Thursday. As I type this now, 1310 already long gone (a day is too long for VST swing), so forget it...

Let me go back to track down my last 'lockstep' chart, and use that to find what's next in shop to step on, see if you guys can make sense out of.

Connecting to last chart is this Friday's chart: Now with room to insert, I am sure you can see what I meant about those circled junctures compatible to each own sets of Thin Green and Light Blue parallel lines.
Posted Image

Also last Friday's chart: We can see clearly in this chart, the IH&S is still alive and kicking. The two downward arrows pointing a "Complex Head" on a newer red shoulder line. If you compare this to that previous IH&S BO'ed chart. This chart answering why that BO might not have happened, due to the additional price movements since.

We COULD see at least two more 'allowable' touches on Neckline to come before a BO again, similar to that on the left side of Neckline marked in 3 small Blue Squares; though not necessary at all. It could be also one big rush BO of Neckline too, or none if down from here.

But, as long as the Green Shoulder-line continue to support; and the lows of Head continue to hold up, in process of doing so, not causing the head too ridiculous out of shape; and the right shoulder not extended too wide; then, BO probability of the Neckline remains high. It better be... with all these restrictions required, right? LOL!
Posted Image

Now.... cooked out exactly as the recipe said, the two sets of circled juncture breakdown almost identical. Blue Rising Wedge broke down but price saved by intervening of the interacting pattern - Complex Inverted H&S. So we bounced from the Green Shoulderline at EOD, with no surprise right on that line just like I showed in Friday's chart.
Posted Image

Am I clear? To me yes. I hope so to you too.
PRICE IS KING; LINE RULES! - Laws Of Line (LOL) Trading Systems
Swing Those Lines: I can calculate the motion of heavenly bodies, but not the madness of people! -- Issac Newton

#48 iloli way

iloli way

    iloli = I'm Laws Of Line's I(eye)

  • TT Member*
  • 4,010 posts

Posted 01 July 2012 - 10:23 AM

6/27: BO back into Blue Wedge had 'told' the tale;...
Posted Image

6/29: "The all-in-one Work" ... again, next "BO probability of the Neckline remains high".
Posted Image
PRICE IS KING; LINE RULES! - Laws Of Line (LOL) Trading Systems
Swing Those Lines: I can calculate the motion of heavenly bodies, but not the madness of people! -- Issac Newton

#49 iloli way

iloli way

    iloli = I'm Laws Of Line's I(eye)

  • TT Member*
  • 4,010 posts

Posted 06 July 2012 - 10:11 AM

July 3rd posted quote:

" Look, I won't post anything because my previous call is still good, no need to post everyday. UNLESS my previous posted line, key line, for price to either jump the hurdle or hit a ceiling, got hit; or any target got hit; how I usually put it- only when Ms. Price calls me.

"Trade Between Lines" means, in a nut-shell - initiate new long/short, add/reduce positions, or take profits - AT the BO/BD of the next line.

Meanwhile it's all about the Red Neckline, hope you've drawn the same line as mine on forexpros and watching it unfold LIVE in real time. Also could refer to my comments and charts about that line for 'refresh' if need to. "

- http://iloliway.blog...-fireworks.html

July 5th posted :

Heads Up ! Red Neck Line Hit !

- http://www.traders-t...howtopic=140641

Posted Image

July 6th, 7:59 AM posted:

Watching It Unfold "LIVE!" ?
We hit the Red Neckline and took profits. We made the first "allowable" Blue small square before the eventual BO of Red Neckline. As long as last Sickle Top 1334, Green Shoulder Line holds, and we may pull back to the Red lower TL and bounce, the I H&S is still working on the BO of Neckline.


- http://iloliway.blog...nfold-live.html

Posted Image
PRICE IS KING; LINE RULES! - Laws Of Line (LOL) Trading Systems
Swing Those Lines: I can calculate the motion of heavenly bodies, but not the madness of people! -- Issac Newton

#50 iloli way

iloli way

    iloli = I'm Laws Of Line's I(eye)

  • TT Member*
  • 4,010 posts

Posted 11 July 2012 - 02:13 PM

Are You Watching It UNFOLD, LIVE! ?
PRICE IS KING; LINE RULES! - Laws Of Line (LOL) Trading Systems
Swing Those Lines: I can calculate the motion of heavenly bodies, but not the madness of people! -- Issac Newton