

Mid Caps
Started by
PIK.
, Mar 22 2012 05:52 PM
No replies to this topic
#1

PIK.
-
- TT Member+
- 837 posts
Member
Posted 22 March 2012 - 05:52 PM
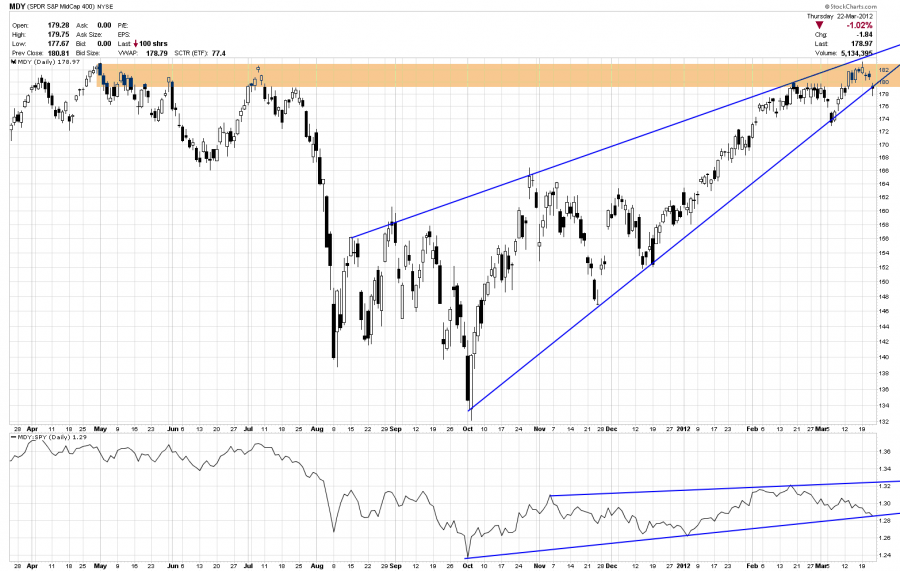
Price for the mid cap stocks has been contained well within 2 converging t-lines during the rally. The upper horizontal resistance zone from the previous top has rejected price again . Currently, price is testing the bottom rising t-line again while price relative to the 500 is also testing an important t-line support area. The price pattern for mid-caps is also similar to that of the equal-weight 500. I am not currently involved at all with the mid-caps just large cap at this point, however, an additional move down from here will break this defined pattern and confirm the under performance relative to large caps. Conversely, if price holds here and rallies above resistance, it will display a sign of significant strength.
For now, this area of the market is under performing relative to the large cap stocks as it struggles at the all-time highs.
Trade based on what you see happening, not what someone else thinks or hopes will happen.


