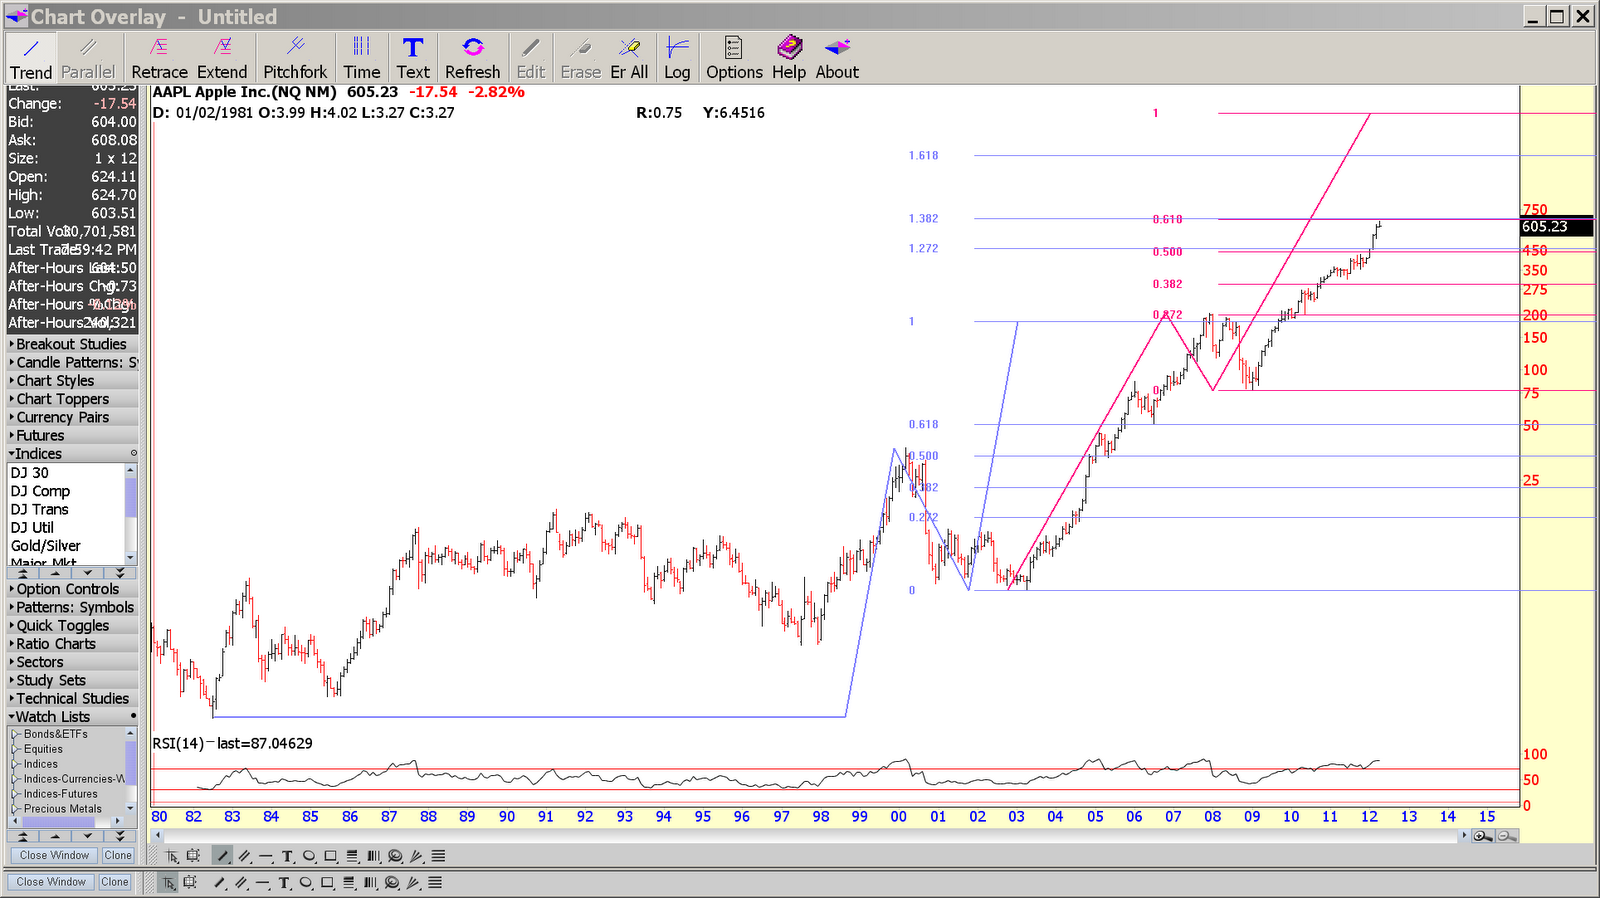
The next chart shows a confluence of two different fib projections to the 640 to 660 area. AAPL has most likely topped, but can't yet rule out another run-up to 666 (which is the devilish price the S&P bottomed at in 2009). The high so far is 644 on 4/10/12 which may be it. Potential targets are noted on the first chart above.
Kimston