
AAPL - Technical view --> Long here
Started by
Costa
, May 15 2012 04:47 PM
No replies to this topic
#1

Costa
-
- Traders-Talk User
- 660 posts
Member
Posted 15 May 2012 - 04:47 PM
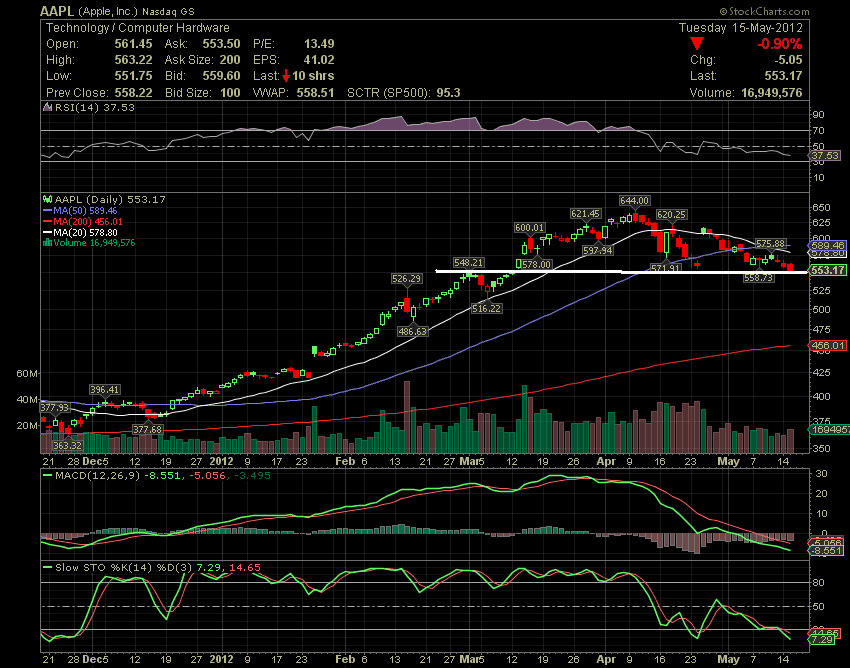
The technical chart shows that the bears are fighting back. The stock managed to climb up above the 20-day SMA late in April after the earnings report but failed. A sharp correction has dropped the stock below its 20-day and 50-day SMAs, and the 600 level. As long as the stock trades above its rising 200-day SMA, the bulls will remain in the game. Looking at the chart, the technical indicators are looking bearish. The slow STO has fallen sharply towards its oversold zone and the MACD has dropped into negative territory below its signal line. In addition, the RSI has crossed below its 50% level. However, the stock closed today near its major support of 549 and we may see rally from this levels. Traders should go long using a stoploss below support and hope for targets of 578-589 means 4-6% gains in 1-2 weeks time frame. Any upward bounce towards the 50-day SMA is likely to be used as a selling opportunity by the bears.
Costa
AC Investor Blog Keep up to date by subscribing AC Investor Blog newsletter or RSS feed. You may wish to also follow me on Twitter.
AC Investor Blog Keep up to date by subscribing AC Investor Blog newsletter or RSS feed. You may wish to also follow me on Twitter.


