Tim Ord, Editor 16928 Van Dorn Street Walton, Nebraska 68461
www.ord-oracle.com (402) 486-0362. tim@ord-oracle.com
For 30 to 90 days horizons SPX: Flat
Monitoring purposes GOLD: Gold ETF GLD long at 173.59 on 9/21/11
Long Term Trend monitor purposes: Flat
We have "800" phone update that cost $2.00 a min. and billed to a credit card. Call (1-970-224-4441) for sign up. We update Eastern time at 9:45 and 3:15. Question? Call (402) 486-0362.

Chart
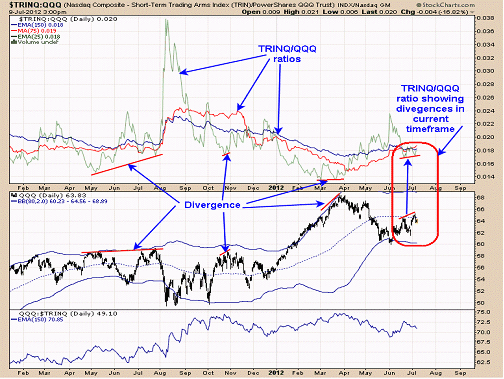
We are showing the TRINQ/QQQ ratio instead of the TRIN/SPY ratio in that the TRINQ/QQQ ratio is shows a clearer picture but both ratios are showing negative divergences. In general the TRINQ/QQQ ratio trades opposite of the QQQ index. Divergences show up when QQQ makes a higher high and TRINQ/QQQ ratio makes a higher low (like now). We have pointed out previous times over the last year on the chart above when this type of divergence showed up. This type of indicator normally picks out pull backs in the market that may last a
couple of weeks or longer and therefore most of July may prove to be a weak month. The bigger picture remains bullish and we will be looking for a buy signal on this potential pull back. At the moment the 133 range of the SPY seems like a likely target but that target could change.

Chart
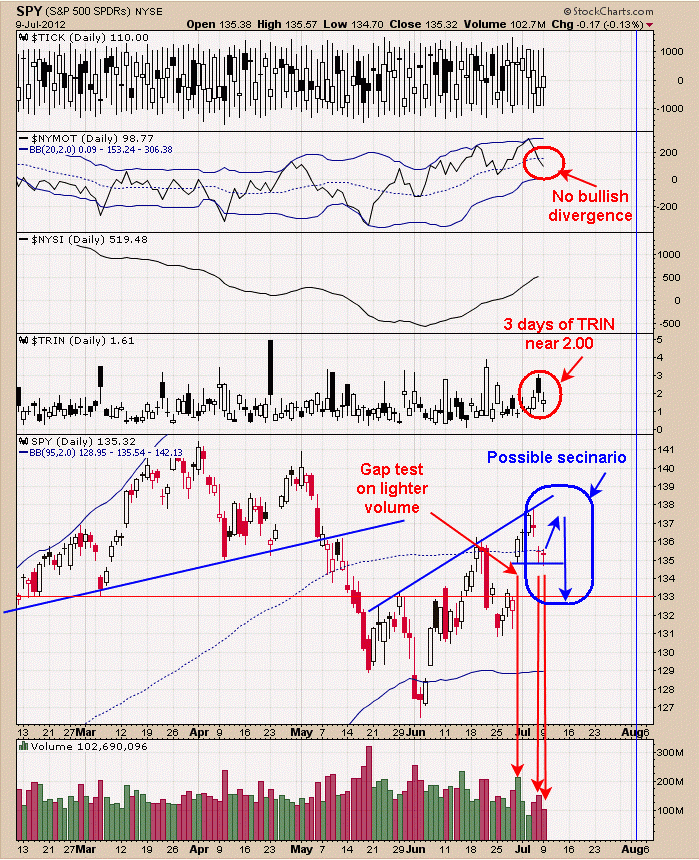
Friday and today the SPY has been testing the June 29 gap area near 135 on the SPY on lighter volume and suggests short term support. Also the TRIN has been closing near 2.00 for the last three days which is oversold on a short term bases and suggest the market may bounce near term. This potential bounce could test last Thursday high before turning back down. In general market could get to 133 range on the SPY before the month is out. We remain flat for now
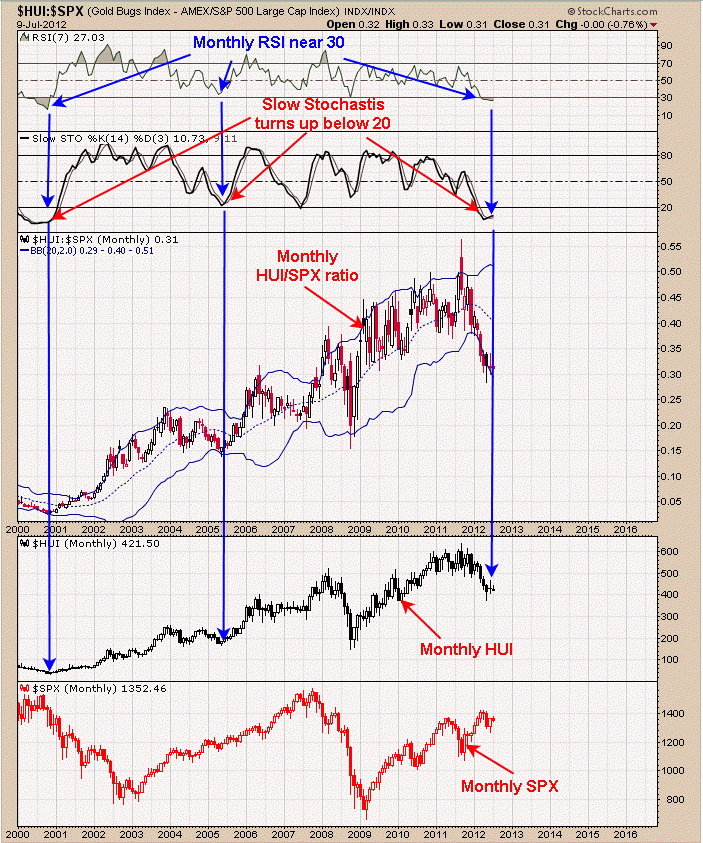
Above is the monthly HUI/SPX ratio dating back to 2000. The Monthly RSI and Slow Stochastics are for the HUI/SPX ratio. When both the monthly RSI hits near 30 and monthly Slow Stochastics turns up below 20 for the HUI/SPX ratio, than a bullish signal is generated for the HUI. Notice this type of bullish signal was generated for the HUI in mid 2000 and close to the top in the SPX. Over the next two years the HUI nearly doubled and the SPX nearly split in half. These type of signals normally last a year or longer and we are expecting at least a 12 month rally from here. The SPX in general looks good into the election but most likely the Gold index will do better and keep on rally for the next 12 months or longer.

Chart
Long GDX 58.65 on 12/6/11. Long SLV at 29.48 on 10/20/11. Long GDXJ average 29.75 on 4/27/12. Long GLD at 173.59 on 9/21/11. Long BRD at 1.67 on 8/3/11. Long YNGFF .44 on 7/6/11. Long EGI at 2.16, on 6/30/11. Long GLD at 147.14 on 6/29/11; stop 170 hit = gain 15.5% . Long KBX at 1.13 on 11/9/10. Long LODE at 2.85 on 1/21/11. Long UEXCF at 2.07 on 1/5/11. We will hold as our core position in AUQ, CDE and KGC because in the longer term view these issues will head much higher. Holding CDE (average long at 27.7.Long cryxf at 1.82 on 2/5/08.KGC long at 6.07. Long AUQ average of 8.25. For examples in how "Ord-Volume" works, visit www.ord-oracle.com. New Book release "The Secret Science of Price and Volume" by Timothy Ord, buy on www.Amazon.com


