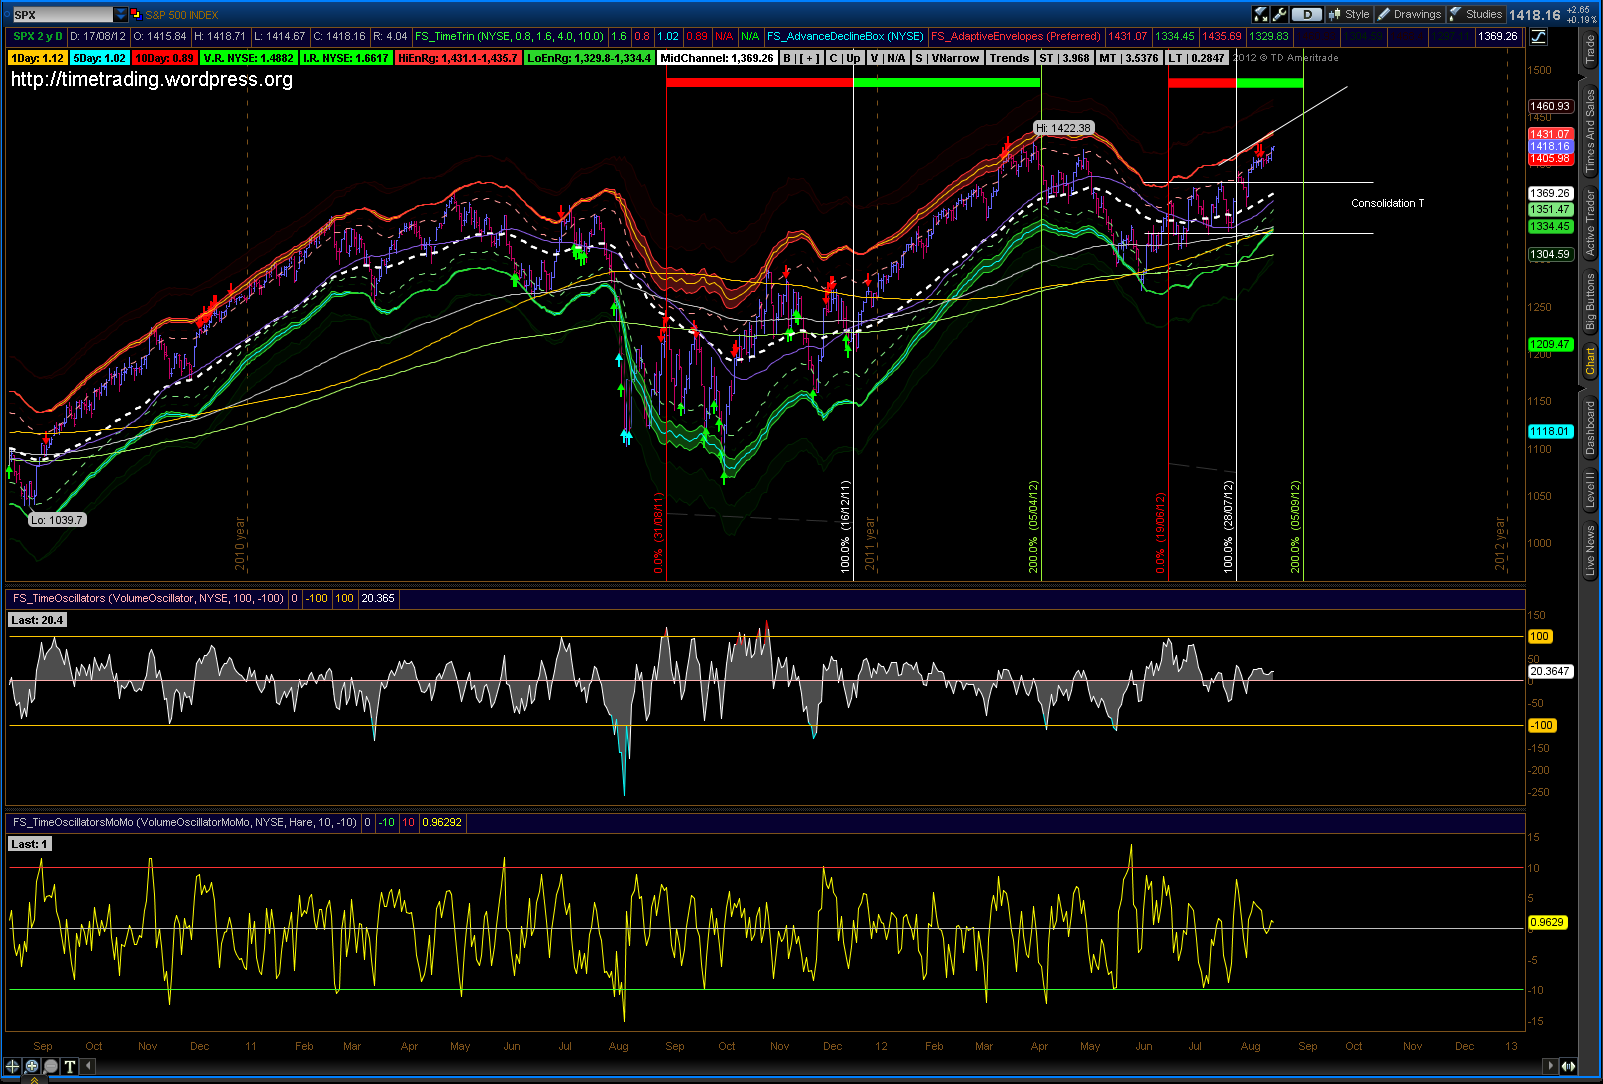
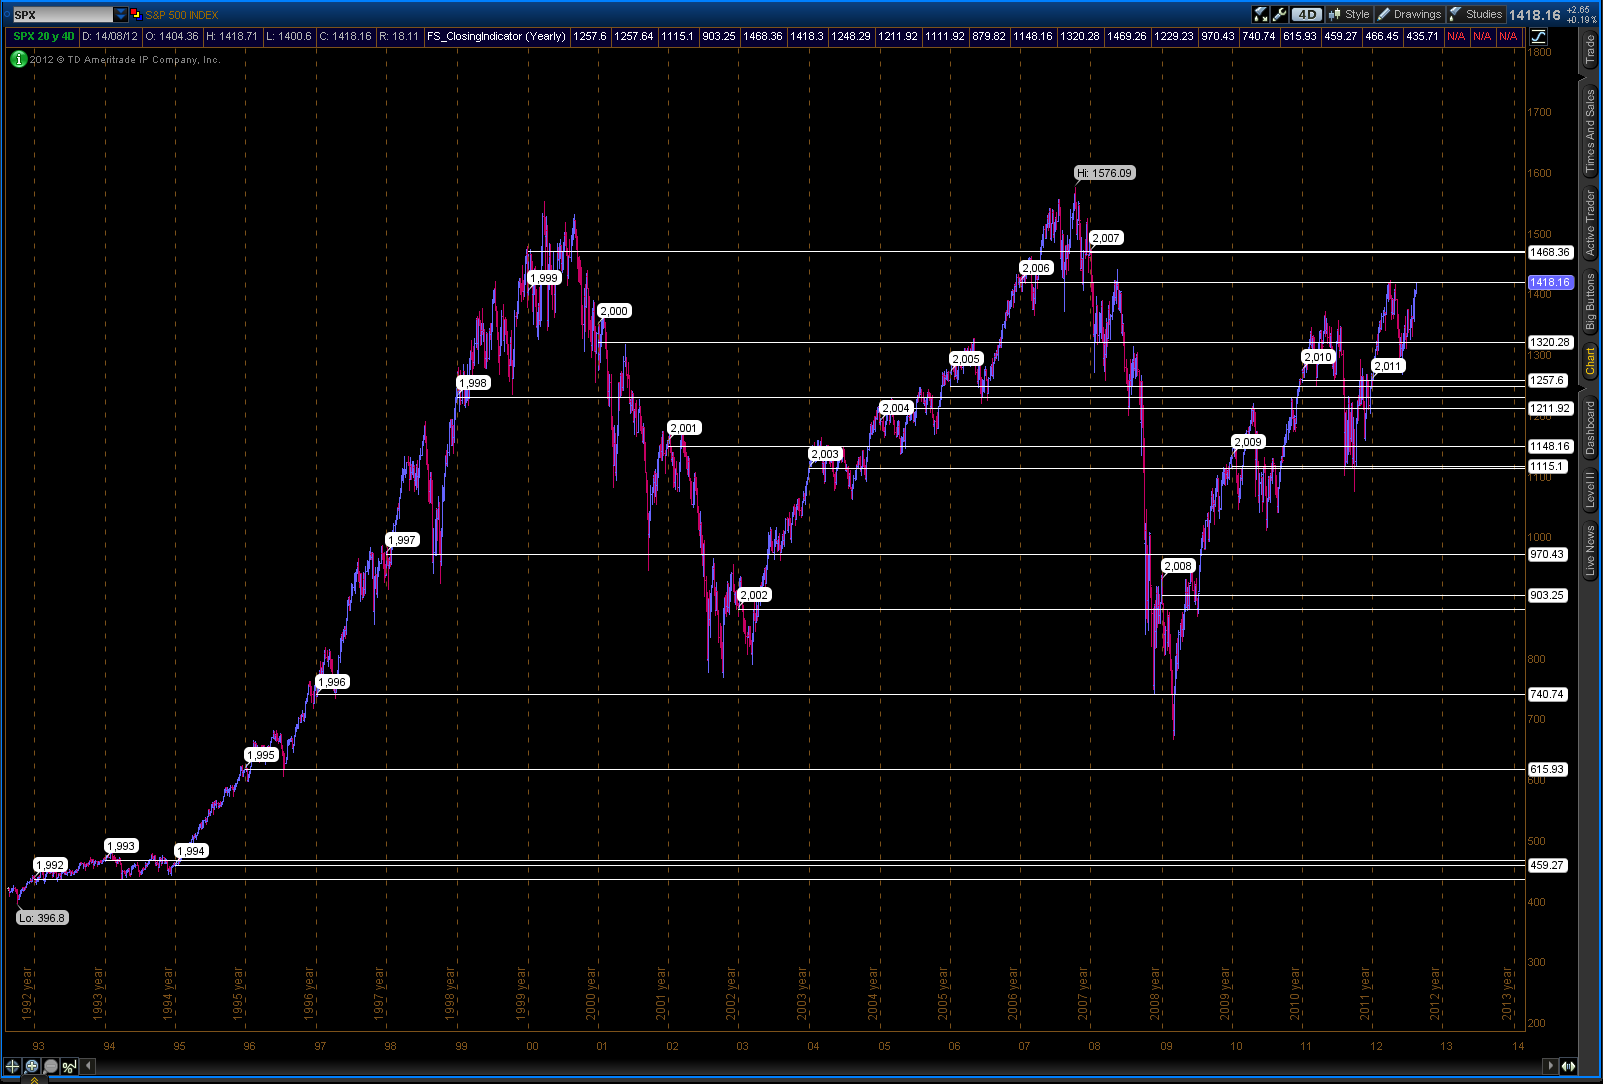
Simple trendline projection says 1450ish above the 2006 psychological close are 1999 & 2007 closes. The average between these two is about 1450ish and possibly is alternating between touch and midpoint maybe an invisible HVN/LVN. The last two arms arrows were above sine wave resistance indicating initial push and backtest. Anyway time will tell.
Weekend T Timing Charts
Started by
Mr. T
, Aug 17 2012 05:43 PM
No replies to this topic
#1
Posted 17 August 2012 - 05:43 PM
I pity the fool.
http://timetrading.wordpress.com
Disclaimer: None of my posts are meant to be taken as investment advice or trading advice. Do your own due diligence and consult your financial advisor before making any trades or investments.
http://timetrading.wordpress.com
Disclaimer: None of my posts are meant to be taken as investment advice or trading advice. Do your own due diligence and consult your financial advisor before making any trades or investments.